
How to Deploy and Utilize Vultr Open Cluster Manager Marketplace Application
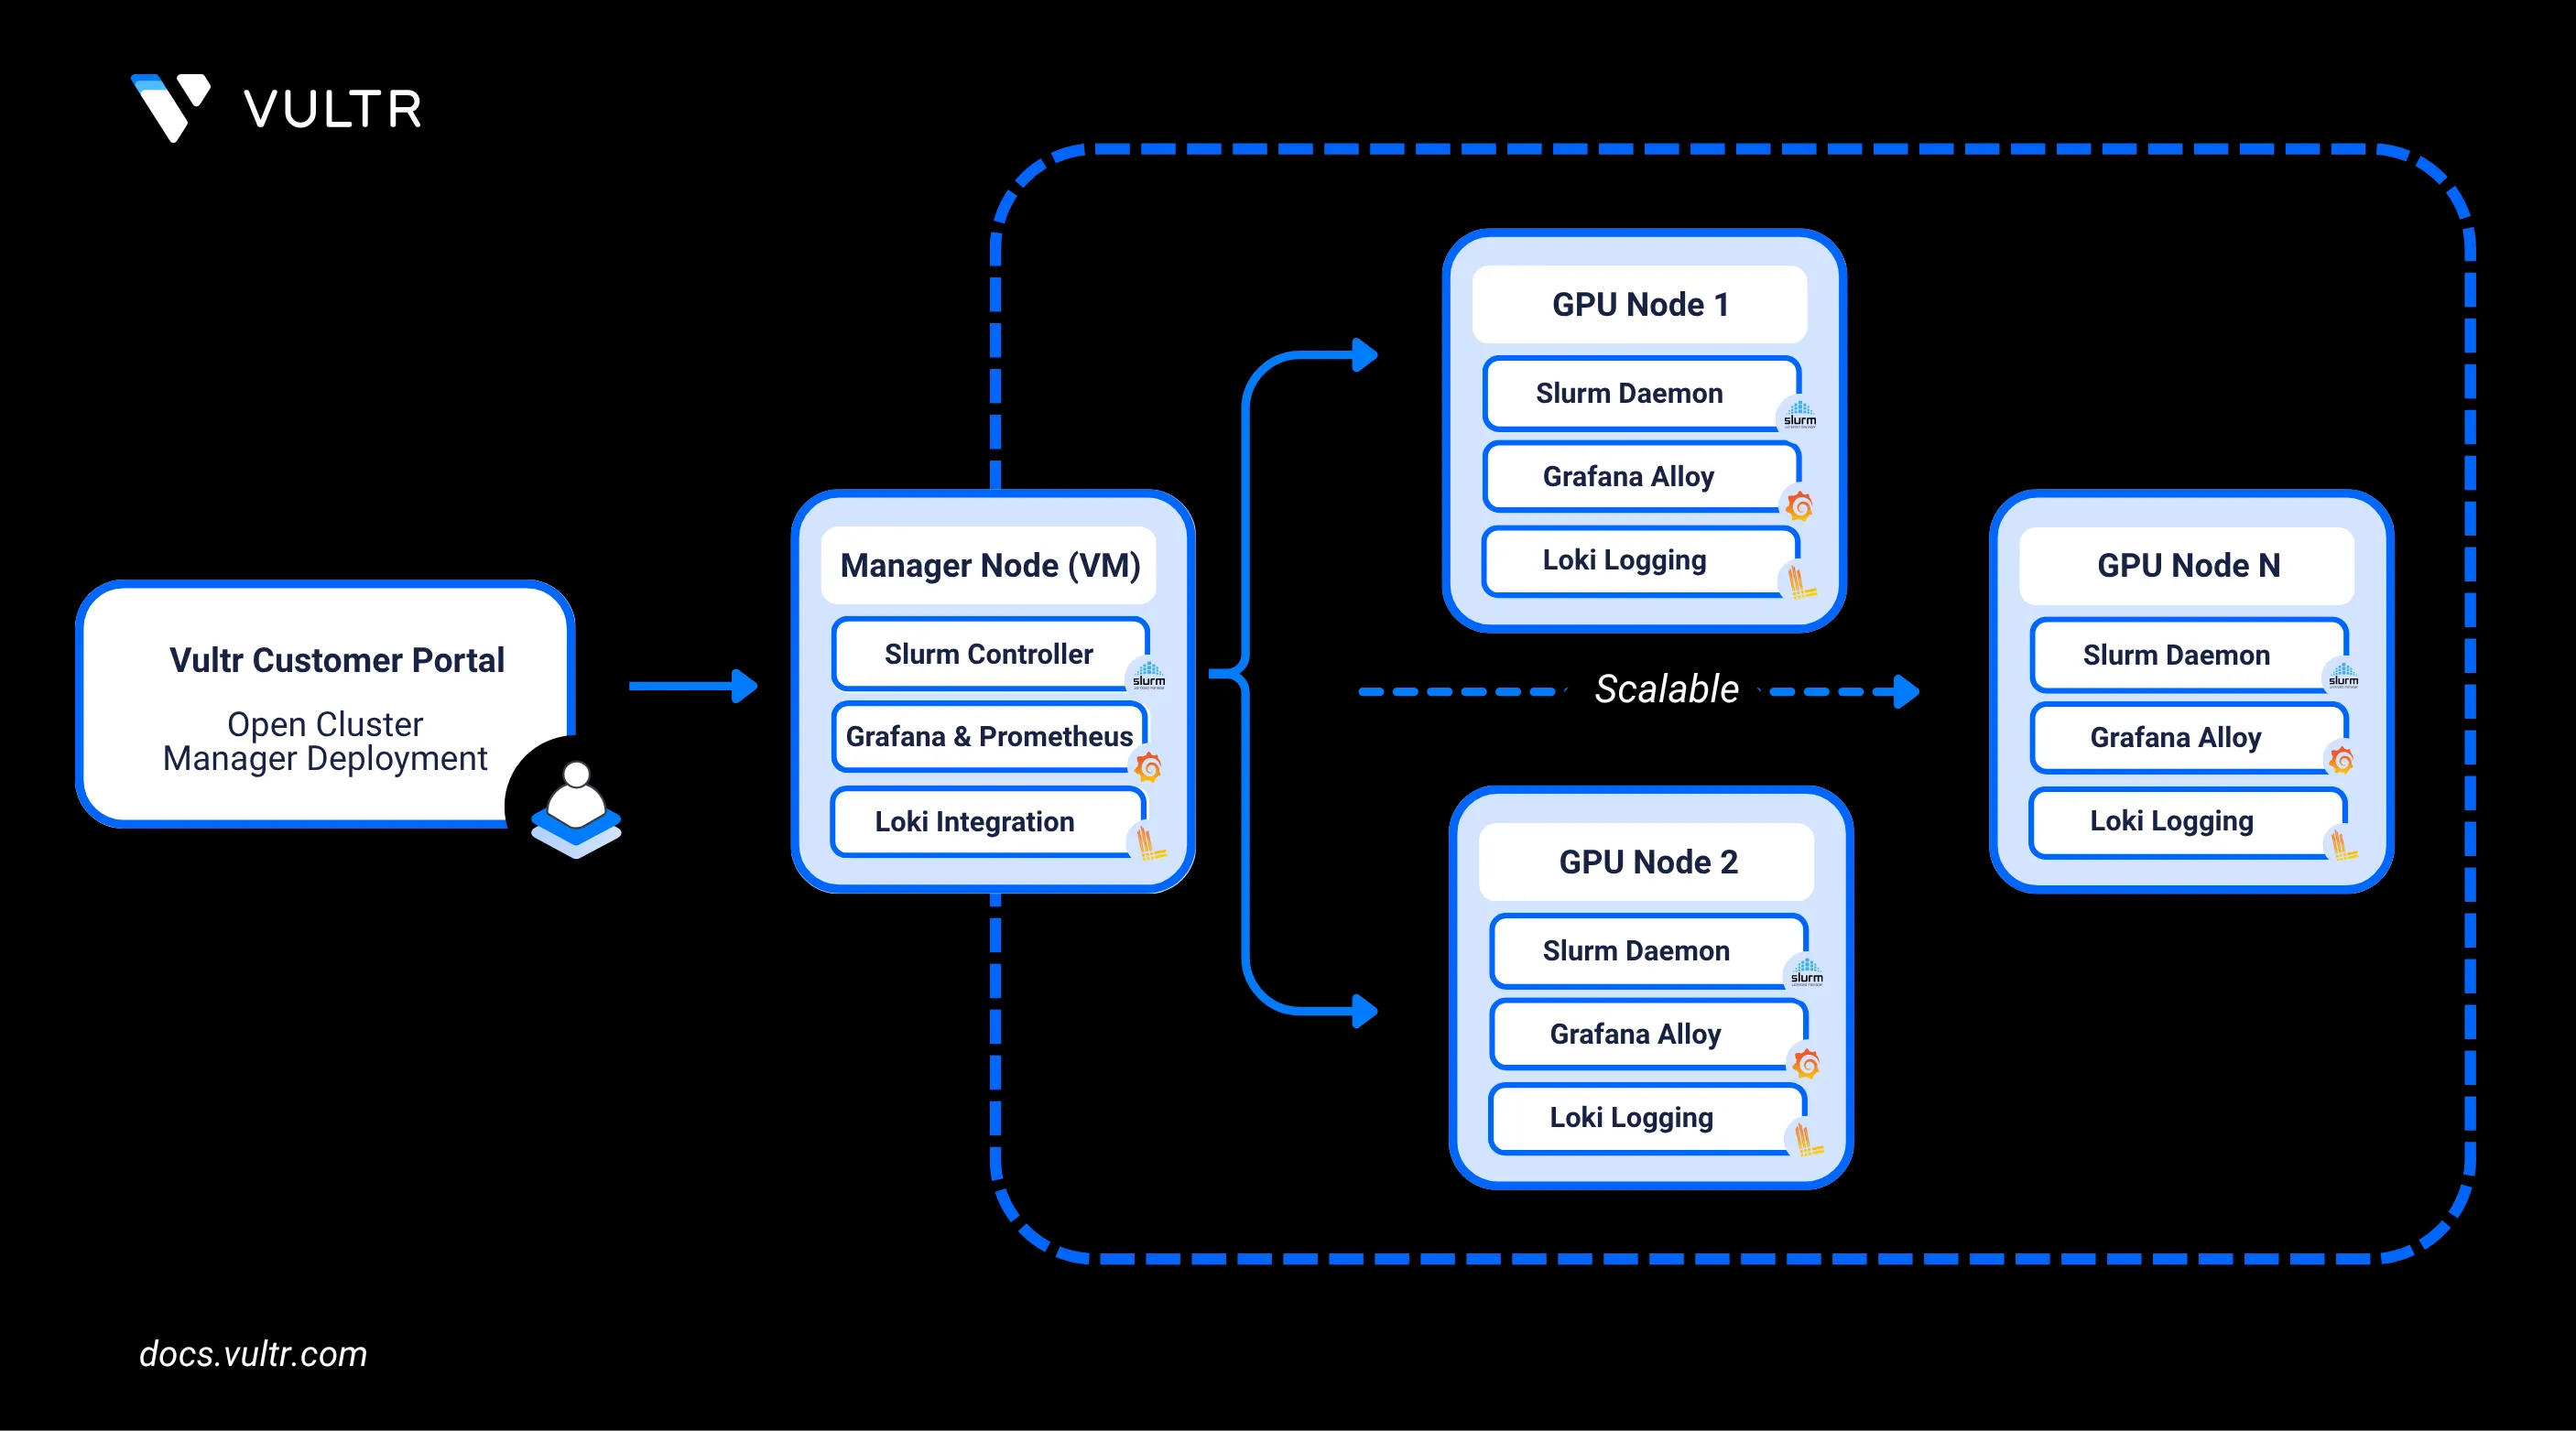
Vultr's Open Cluster Manager Marketplace Application is a pre-configured, infrastructure automation solution designed to simplify the deployment of GPU-accelerated clusters on Vultr. It leverages Terraform and Ansible to provision and configure compute resources, networking, monitoring tools, and workload management systems. The application includes built-in support for tools like Grafana, Prometheus, Loki, and Slurm, enabling users to monitor GPU metrics, collect logs, and manage job scheduling seamlessly across a distributed cluster.
In this guide, you’ll learn how to deploy the Open Cluster Manager application from the Vultr Marketplace, customise the infrastructure configuration to match your GPU requirements, and build a GPU cluster. You’ll also set up performance monitoring and centralized logging, access a preconfigured Grafana dashboard, and scale the cluster up or down based on your workload needs.
Prerequisites
Before you begin, you need to:
- Have access to your Vultr API Key.
0.0.0.0/0) to ensure user-space tools can access the Vultr API. If using a reserved IP, only that specific IP reservation needs to be added to the ACL. Additionally, ensure the cluster manager is deployed in a region with available inventory of the desired SKU for cluster nodes. This is required for the manager to create a VPC and enable private communication between itself and all subsequent nodes.
Deploy Vultr Open Cluster Manager Marketplace Application
In this section, you are to deploy the Vultr's Open Cluster Manager Marketplace Application on a Vultr instance. The steps involve selecting a suitable server type, region, and plan (GPU is not required), configuring the software, and providing necessary application variables such as your Vultr API key.
Login into your Vultr Console
Navigate to Compute under the Products section, then click Deploy.
Select your server type, region and plan.
You can opt a non-GPU plan for the Open Cluster Manager instance. The application does not require GPU resources.NoteClick Configure Software.
Under the Marketplace Apps section, search for Open Cluster Manager and select the application.
Provide the below specified app variable.
vultr_api_key(Required): Your Vultr API key. This is required for the manager to communicate with your account and provision required resources.
Avoid selecting the VPC Networks additional feature during the provisioning, as the Open Cluster Manager automatically provisions a VPC network as part of the cluster setup process.
Click Deploy to start the provisioning process.
The deployment process can take from 10-15 min to complete, you can review the process by opening the server console.Note
The cloud-init script runs at instance deployment and performs several setup tasks. It retrieves user-provided variables (e.g., Vultr API key) via the Metadata API and stores them in /etc/environment. It installs the Vultr CLI, Ansible, Terraform, and Docker, generates an SSH keypair, and adds the public key to the Vultr account. The script then creates a VPC network, updates configuration values in /root/config.yml.sample, renames it to /root/config.yml, and attaches the VPC, triggering a reboot.
Review and customise the Infrastructure Configuration
In this section, you’ll SSH into your deployed Vultr instance and review the default configuration file located at /root/config.yml. The Terraform configuration defines the infrastructure such as GPU type, region, and instance count. You can customise these settings based on your specific requirements.
After the deployment process is completed SSH into your Vultr instance by using root user credentials provided in the overview section of Vultr Console.
The default configuration file used to provision the cluster is located at
/root/config.yml. Review and adjust the configuration preferably based on your GPU requirements.console# cat /root/config.ymlThe configuration is organized into two primary sections:
Terraform Configuration
iniinstance_plan: vcg-l40s-16c-180g-48vram os_id: 1743 # Ubuntu 22.04 LTS x64 instance_count: 2 vfs_gb: 0 vfs_id: #Optionally, an existing VFS UUID instance_region: ewr vpc_ids: 71aa7038-63d1-474a-962b-b84773c0a786 fwg_id: ssh_key_ids: [c8e97f26-5e9f-4f5c-9440-265da23a2ca5] hostprefix: ewr-cluster-node hostsuffix: gpu.local
This section defines the infrastructure that Terraform provisions, including GPU type, instance count, region, and networking. It controls how your GPU instances are deployed on Vultr.
instance_plan: The GPU instance type to deploy.vcg-l40s-16c-180g-48vramindicates a high-performance L40S instance.os_id: Operating system ID.1743corresponds to Ubuntu 22.04 LTS x64 in the Vultr OS catalog.instance_count: Number of cluster nodes to provision.vfs_gb: 0: If set to a value greater than 0, a Vultr File System is automatically created, and is attached, and mounted to all cluster nodes and the Cluster Manager.vfs_id:: You may optionally specify the UUID of an existing Vultr File System (located in the same region) to attach to the instances. If this parameter is provided, it will override thevfs_gboption, meaning a new File System will not be created and the existing one will be used instead.instance_region: Region code.ewrrefers to the New Jersey region.vpc_ids: ID of theVPC networkwhere the cluster will be deployed.fwg_id: (Optional) ID of a pre-configured firewall group.ssh_key_ids: List of SSH key IDs to be injected into the nodes.hostprefix/hostsuffix: Naming convention for cluster nodes.
Provision the GPU Resources
After you review and update the /root/config.yml file to match your GPU and networking requirements, you can build the cluster using the provided automation script or manually execute each step.
To automatically build the cluster, run the following script:
# /root/build-cluster.sh
The build-cluster.sh script provisions the infrastructure using Terraform, configures the infrastructure using Ansible, and, upon completion, provides a Grafana dashboard URL to monitor GPU metrics and cluster performance.
/root/build-cluster.sh script. The playbook is designed to be idempotent and will reattempt any failed steps.
If you prefer more control or wish to troubleshoot the provisioning process, you can manually execute each step to build and configure the GPU cluster using Terraform and Ansible.
Change into the Terraform working directory.
console# cd /root/terraformInitialize the Terraform project.
console# terraform initReview the execution plan.
console# terraform planApply the Terraform configuration to provision the GPU nodes.
console# terraform applyWait for all cluster nodes to be fully deployed and online before continuing.
Change into the Ansible configuration directory.
console# cd /root/ansibleRun the Ansible playbook to configure all nodes.
console# ansible-playbook -i hosts cluster.ymlThis playbook performs the following actions:
- Updates all GPU nodes and the manager with the latest system packages.
- Installs Grafana Alloy on each node for real-time metrics collection.
- Configures Grafana Alloy to forward logs to your Loki instance (if provided).
- Installs and sets up the Slurm Daemon (
slurmd) on all GPU nodes. - Installs and configures the Slurm Controller (
slurmctld) on the manager node. - Deploys Grafana, Prometheus and Loki containers via Docker on the manager (refer to
/root/docker-compose.yml). - Installs Prometheus Node Exporter on all cluster nodes for hardware and OS-level monitoring.
- Adds a preconfigured Node Exporter dashboard to the local Grafana instance.
- On Nvidia based systems, this playbook will download, compile, and install the Pyxis plugin for Slurm enabling Nvidia Enroot containers to be run in workloads.
- Once the playbook completes, your GPU cluster is fully configured to schedule Slurm jobs and collect performance metrics.
Print each nodes's hostname for confirmation.
# srun -N2 hostname
Access Grafana Dashboard
After the cluster is deployed, you can access the Grafana dashboard to monitor GPU metrics and cluster performance.
Open the following URL in your browser, replacing
<SERVER-IP>with your actual server IP.http://<SERVER-IP>:3000On the login screen, enter the following credentials:
- Username:
admin - Password: Available in the Vultr Console under the instance's Application Instructions section.
- Username:
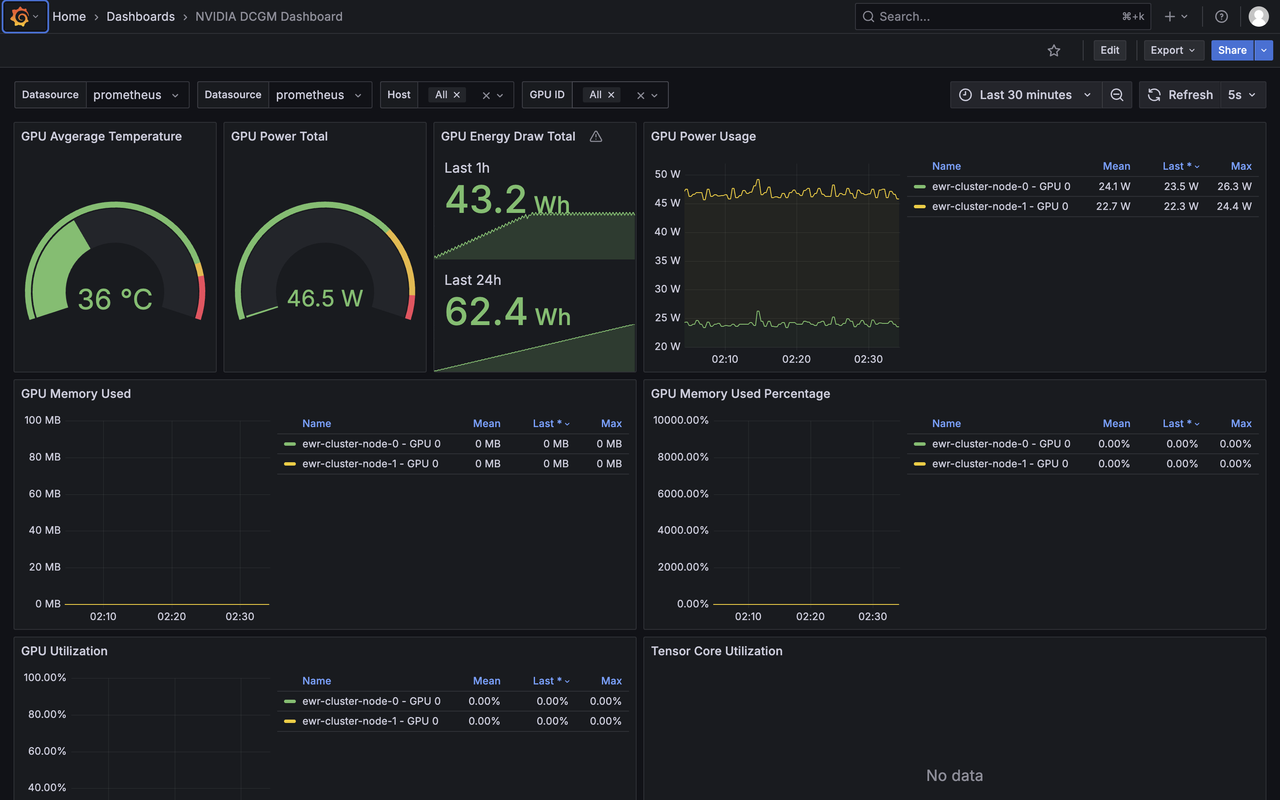
View GPU Monitoring Dashboards
After logging in to Grafana, follow the steps below to access the preconfigured dashboards for monitoring system and GPU metrics across your cluster.
In the Grafana sidebar, click the Dashboards icon.
Navigate to Browse to view available dashboards.
Select one of the following dashboards to open it and begin monitoring metrics. The dashboards should look like the one below:
Scale the Cluster
To increase/decrease the number of GPU resources in your cluster, edit the configuration file and rerun the provisioning script.
Open the cluster configuration file to increase the number of instance.
console# vim /root/config.ymlLocate the
instance_countparameter and update its value to the desired number of nodes.ini... instance_count: {int_instance_count} ...
Save and close the file.
Rebuild the cluster using the automation script to apply the new changes.
console# /root/build-cluster.shThis script adjusts instance count and reconfigures the cluster according to the
instance_countvalue provided.
instance_count, auto-configures them, and integrates them into Grafana. Scaling down deletes nodes exceeding the new count and updates dashboards accordingly. Always back up critical data before scaling down.
Conclusion
By following this guide, you’ve successfully deployed the Vultr Open Cluster Manager Marketplace Application, provisioned GPU resources, and configured your cluster for monitoring and workload management. The automation scripts and pre-built dashboards streamline the setup process, giving you a ready-to-use GPU cluster with Grafana, Prometheus, and Slurm integration. Whether you're running compute-intensive workloads or monitoring system performance, the cluster is flexible and easy to scale as your requirements evolve.