How to Deploy Apache Flink on Kubernetes Engine as Alternative to GCP Dataflow
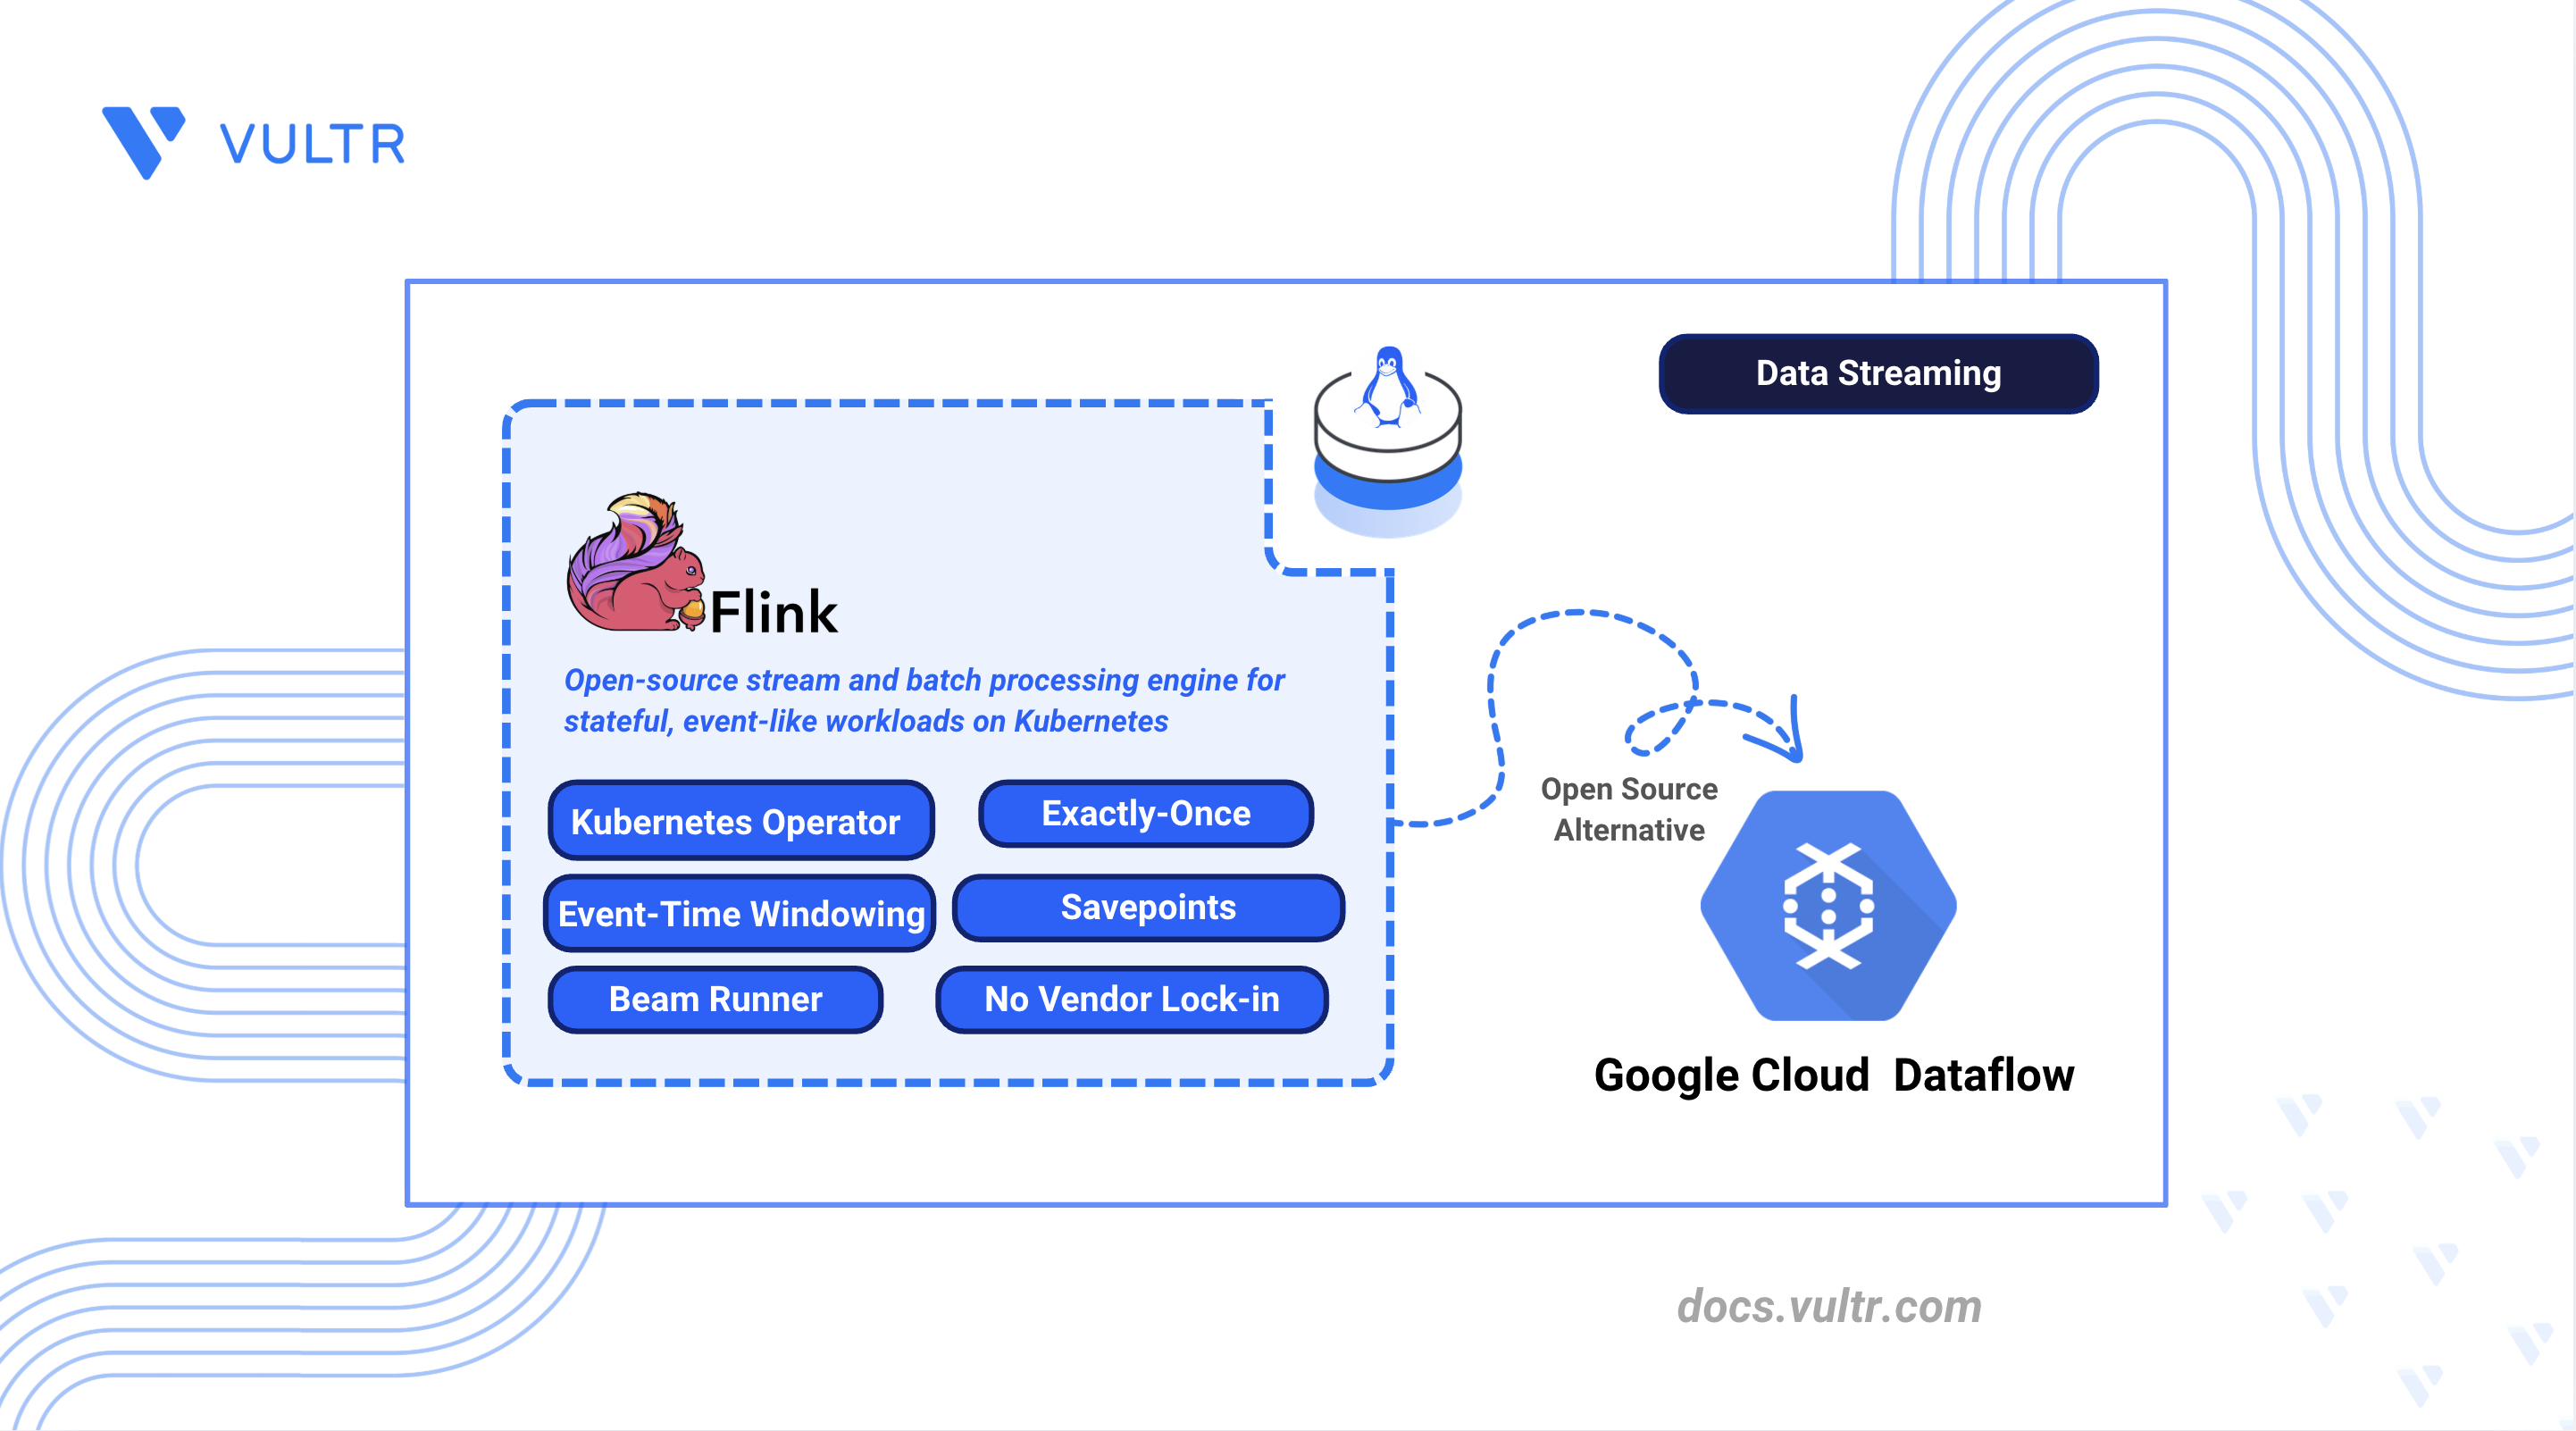
Google Cloud Dataflow is a managed stream and batch processing service built on Apache Beam. It offers autoscaling, event-time processing, windowing, stateful computations, and exactly-once guarantees, but it ties deployments to Google Cloud services and ongoing managed service costs.
Apache Flink is an open-source distributed processing engine for stateful computations over bounded and unbounded data streams, and it covers the same ground as a self-hosted deployment without ongoing managed service costs. It supports stateful processing, checkpointing, savepoints, event-time windowing, and Apache Beam pipelines through the Flink Runner, while the Flink Kubernetes Operator deploys and manages Flink clusters using native Kubernetes resources.
This article explains how to deploy Apache Flink as an alternative to Google Cloud Dataflow. It covers Session and Application Cluster deployments using the Flink Kubernetes Operator, state management, checkpointing, exactly-once processing with Kafka, Apache Beam integration, monitoring, high availability, security, and migration strategies from Google Cloud Dataflow.
Understanding Flink Architecture
Apache Flink provides many of the stream and batch processing capabilities available in Google Cloud Dataflow through a self-managed Kubernetes deployment. The following table compares Dataflow components and features with their closest Apache Flink equivalents:
Key components of Apache Flink include:
- JobManager: Coordinates job scheduling, checkpoints, recovery, and TaskManager operations.
- TaskManager: Executes processing tasks and maintains application state assigned to its task slots.
- Flink Kubernetes Operator: Automates the deployment, upgrade, scaling, recovery, and lifecycle management of Flink clusters and applications.
- State Backend: Manages the working state used by stateful Flink operators.
- Checkpoint Storage: Stores checkpoint and savepoint data in durable storage for recovery and application upgrades.
- Checkpoints: Automatically created state snapshots used for fault recovery and exactly-once processing.
- Savepoints: Manually triggered state snapshots used for controlled upgrades, migration, and operational recovery.
Prerequisites
Before you begin, you need to:
- Have access to a Kubernetes cluster, such as Vultr Kubernetes Engine, running Kubernetes 1.31 or later with at least 4 CPU cores and 16 GB of RAM per node. A minimum of three worker nodes is recommended.
- Install
kubectland configure access to the cluster. - Install Helm 3 on your management workstation.
- Install Java 11 or later and Apache Maven.
- Configure a default Kubernetes
StorageClassfor persistent Kafka storage. - Create a bucket on an S3-compatible object storage service, such as Vultr Object Storage. Record the bucket name, hostname, access key, and secret key.
- Have a basic understanding of Kubernetes resources and stream-processing concepts.
Install the Flink Kubernetes Operator
The Apache Flink Kubernetes Operator extends Kubernetes with custom resources that simplify the deployment and lifecycle management of Apache Flink clusters and applications. It automates operations such as upgrades, scaling, savepoint management, and recovery while allowing you to manage Flink deployments using native Kubernetes resources.
Install cert-manager
The Flink Kubernetes Operator uses admission webhooks that require TLS certificates. Install cert-manager before deploying the operator.
Verify the Kubernetes cluster connection.
CONSOLEVerify that all worker nodes are in the
Readystate.CONSOLEAdd the Jetstack Helm repository.
CONSOLEUpdate the Helm repository cache.
CONSOLEInstall
cert-manager, create thecert-managernamespace, and install the required Custom Resource Definitions.CONSOLEVerify that all
cert-managerpods are running.CONSOLEOutput:
Install the Apache Flink Kubernetes Operator
Add the Apache Flink Helm repository for version
1.15.0. This article uses the Flink Kubernetes Operator version1.15.0. Visit the Flink Kubernetes Operator downloads page to confirm the latest release, and replace the version in the repository URL if a newer version is available.CONSOLEUpdate the Helm repository cache.
CONSOLECreate a dedicated namespace for the Flink Kubernetes Operator.
CONSOLEInstall version
1.15.0of the Flink Kubernetes Operator in theflink-operatornamespace.CONSOLEVerify that the operator deployment is available.
CONSOLEOutput:
Verify that the operator pod is running.
CONSOLEOutput:
Deploy a Flink Session Cluster
A Flink Session Cluster runs a long-lived JobManager and TaskManager deployment that can accept multiple Flink jobs. This mode is useful when you want to submit and manage several jobs without creating a separate cluster for each workload.
Create a working directory for the Flink manifests.
CONSOLESwitch to the working directory.
CONSOLECreate a namespace for Flink workloads.
CONSOLECreate a service account for Flink.
CONSOLECreate a role binding that allows the Flink service account to manage resources in the
flinknamespace.CONSOLECreate a
session-cluster.yamlmanifest.CONSOLEAdd the following configuration to the file.
YAMLNote
The local checkpoint and savepoint directories validate the Session Cluster configuration but do not preserve state after pod replacement. The Configure State Management section replaces these paths with durable Object Storage.
The configuration:
- Deploys a reusable Flink Session Cluster using the Flink Kubernetes Operator.
- Allocates CPU and memory resources to the JobManager and TaskManagers.
- Configures two task slots for each TaskManager.
- Sets local checkpoint and savepoint directories for deployment testing.
- Uses the
flinkservice account to manage resources in theflinknamespace.
Save and close the file.
Apply the Flink Session Cluster manifest.
CONSOLEVerify that the Flink deployment is created.
CONSOLEVerify that the
flink-session-clusterresource displays aSTABLElifecycle state.Verify that the Flink Session Cluster pods are running.
CONSOLEVerify the Flink services.
CONSOLEThe output displays the services created for the Flink Session Cluster, including the REST service used to access the Flink Web UI.
Submit a Flink Job
A FlinkSessionJob submits an application to an existing Flink Session Cluster without creating a separate Flink cluster for each workload. The application is packaged as a Java Archive (JAR) file and managed as a Kubernetes custom resource, making deployments and updates consistent with standard Kubernetes workflows.
Create a directory for the sample Flink application.
CONSOLESwitch to the project directory.
CONSOLECreate the Maven project configuration file.
CONSOLEAdd the following configuration to the file.
XMLThe configuration:
- Defines a Maven project for the sample Flink application.
- Uses Apache Flink 1.20 libraries.
- Configures Java 11 as the build target.
- Packages the application into a deployable JAR.
Save and close the file.
Create a sample streaming application.
CONSOLEAdd the following application.
JAVAThe application:
- Creates a Flink streaming execution environment.
- Processes a sample stream of events.
- Converts each event to uppercase.
- Prints the processed events to the application logs.
Save and close the file.
Build the application.
CONSOLEVerify that Maven creates the application JAR.
CONSOLEVerify that the output includes the
flink-session-job-1.0.0.jarfile.Note
The sample application demonstrates how to package a Flink job into a deployable JAR. The following steps submit an official Apache Flink example application hosted on Maven Central. Using a publicly accessible JAR provides a reproducible deployment without requiring additional artifact storage or container image customization. Later sections configure durable storage for Flink applications and state.
Switch to the Flink manifest directory.
CONSOLECreate the session job manifest.
CONSOLEAdd the following configuration:
YAMLThe configuration:
- Submits a streaming application to the existing Flink Session Cluster.
- Downloads the application JAR from Maven Central.
- Runs the application with a parallelism of 2.
- Uses the stateless upgrade mode for application updates.
Save and close the file.
Apply the session job manifest.
CONSOLEVerify that the session job is created.
CONSOLEOutput:
Verify that the Session Cluster runs the submitted job.
CONSOLESet up port forwarding to access the Flink dashboard.
CONSOLEOpen
http://localhost:8081in your web browser to access the Apache Flink dashboard.The Flink dashboard displays running jobs, TaskManagers, checkpoints, and cluster resources. Verify that the submitted job appears in the Running Jobs section with a
RUNNINGstatus. Select the job to view execution details and task metrics.
Deploy a Flink Application Cluster
A Flink Application Cluster creates a dedicated cluster for a single application. It deploys the application with a JobManager and TaskManagers. Each application uses dedicated resources and has an independent lifecycle.
Create a Kubernetes Secret using your Object Storage credentials. Replace
YOUR_ACCESS_KEYwith your Object Storage access key andYOUR_SECRET_KEYwith your Object Storage secret key.CONSOLEVerify that the Secret exists.
CONSOLEOutput:
Create the application cluster manifest.
CONSOLEAdd the following configuration. Replace
YOUR_BUCKET_NAMEwith your Object Storage bucket name andYOUR_OBJECT_STORAGE_HOSTNAMEwith your Object Storage hostname.YAMLThe configuration:
- Creates a dedicated Flink Application Cluster.
- Uses RocksDB as the state backend.
- Creates an incremental checkpoint every 60 seconds.
- Stores checkpoints and savepoints in Object Storage.
- Retains completed checkpoints when the application is canceled.
- Loads Object Storage credentials from a Kubernetes Secret.
- Enables the Flink S3 filesystem plugin.
- Uses savepoints to preserve application state during updates.
- Retries failed jobs three times with a ten-second delay.
Save and close the file.
Apply the manifest.
CONSOLEVerify that the
FlinkDeploymentreaches theSTABLElifecycle state.CONSOLEOutput:
Verify that the JobManager and TaskManager pods are running.
CONSOLEOutput:
Verify the services created for the Application Cluster.
CONSOLEThe
flink-application-cluster-restservice exposes the Flink REST API and Web UI.
Configure State Management
Apache Flink uses a state backend to manage application state during processing. The HashMap state backend keeps state in JVM memory and works well for smaller workloads. RocksDB stores working state on TaskManager disks and supports incremental checkpoints for larger workloads. The Application Cluster uses RocksDB with Object Storage to preserve checkpoints and savepoints outside the Kubernetes cluster.
Verify the state backend, checkpoint directory, and incremental checkpointing configured for the Application Cluster.
CONSOLEOutput:
Verify that the application creates checkpoints successfully.
CONSOLEOutput:
The output confirms that Flink creates checkpoints successfully. The checkpoint directory verified earlier stores the completed checkpoints in Object Storage.
Trigger a savepoint for the running application.
CONSOLEMonitor the state snapshots.
CONSOLEWait until the latest snapshot reaches the
COMPLETEDstate. Press Ctrl+C to stop monitoring.Store the latest state snapshot name in a variable.
CONSOLEVerify the snapshot state.
CONSOLEOutput:
View the savepoint location.
CONSOLEOutput:
Set Up Windowing and Event-Time Processing
Apache Flink uses event timestamps and watermarks to process records that arrive out of order. Windowing groups records by time, while allowed lateness and side outputs handle delayed records.
Switch to the sample application directory.
CONSOLECreate an event-time windowing application.
CONSOLEAdd the following application.
JAVAThe application:
- Extracts the event time from each record.
- Allows records to arrive up to five seconds out of order.
- Groups records into one-minute tumbling windows.
- Creates five-minute sliding windows every minute.
- Groups records into sessions using a two-minute inactivity gap.
- Accepts records until the watermark advances 30 seconds beyond the end of a tumbling window.
- Sends records that exceed the allowed lateness to a side output.
Save and close the file.
Build the application.
CONSOLEVerify that Maven creates the application JAR.
CONSOLEOutput:
Configure Exactly-Once Processing
Apache Flink combines checkpoints with transactional sinks to provide end-to-end exactly-once processing. A Kafka transactional sink writes records inside a transaction and commits it only after the corresponding checkpoint completes, so a job that fails and restarts from the last checkpoint never emits duplicate output to downstream consumers.
Deploy Apache Kafka
End-to-end exactly-once processing requires a message broker with transactional support. Deploy a three-node Apache Kafka cluster with the Strimzi operator to provide the transactional source and sink for the Flink application.
Create a namespace for Kafka resources.
CONSOLEAdd the Strimzi Helm repository.
CONSOLEUpdate the Helm repository information.
CONSOLEInstall the Strimzi Kafka Operator.
CONSOLEVerify that the Strimzi operator is running.
CONSOLEOutput:
Create a Kafka cluster manifest.
CONSOLEAdd the following configuration.
YAMLThe node pool runs three Kafka nodes with persistent storage. Each node acts as a broker and KRaft controller. The replication and in-sync replica settings allow the cluster to continue processing transactions when one broker is unavailable. Strimzi requires Kafka and KafkaNodePool resources for KRaft-based clusters.
Save and close the file.
Deploy the Kafka cluster.
CONSOLEWait for the Kafka cluster to become ready.
CONSOLEVerify the Kafka pods.
CONSOLEOutput:
Verify the internal Kafka bootstrap service.
CONSOLE
Create the Kafka Topics
Create the input topic for incoming events and the output topic for window results. Each topic uses three partitions and three replicas, and requires at least two in-sync replicas to acknowledge writes, so it tolerates one unavailable broker.
Create the Kafka topics manifest.
CONSOLEAdd the following configuration.
YAMLSave and close the file.
Create both topics.
CONSOLEWait for both topics to become ready.
CONSOLEVerify both topics.
CONSOLEOutput:
Enable Exactly-Once Checkpointing
Configure the Flink Session Cluster to create exactly-once checkpoints every 60 seconds.
CONSOLEWait for the Session Cluster to become stable.
CONSOLEVerify the checkpointing mode and interval.
CONSOLEOutput:
Add the Kafka Connector
Switch to the sample application directory.
CONSOLEOpen the Maven project configuration.
CONSOLEAppend the following dependencies to the existing
<dependencies>block.XMLThe connector base dependency provides the
DeliveryGuaranteeclass. The Kafka connector provides the transactional sink and supports Apache Flink 1.20.Append the following plugin to the existing
<plugins>block.XMLThe Maven Shade plugin packages the Kafka connector and its required libraries in the application JAR. The Flink runtime and connector base dependencies remain provided by the Flink cluster.
Save and close the file.
Configure the Kafka Source and Transactional Sink
Open the event-time windowing application.
CONSOLEAppend the following imports to the existing import statements.
JAVALocate the following class declaration:
JAVAAppend the following constant immediately after the class declaration:
JAVALocate the hardcoded event source that begins with:
JAVARemove the
baseTimedeclaration and the completeenv.fromElements()block. Replace them with the following Kafka source configuration.JAVAThe Kafka source reads comma-separated event records from the
flink-eventstopic. Flink stores the consumed Kafka offsets in checkpoints so the application can resume consistently after a restart or failure.Locate the following existing watermark block:
JAVAReplace it with:
JAVALocate the following constructor inside the
Eventclass:JAVAAppend the following method after the constructor:
JAVALocate the following declaration:
JAVAAppend the following Kafka sink configuration after the declaration.
JAVAThe bootstrap address connects the Flink application to the internal Kafka service. The transactional ID prefix must be unique for each running Flink application that writes to the Kafka cluster.
The transaction timeout is set to 15 minutes. This gives Flink enough time to recover and complete a checkpoint before Kafka expires an open transaction.
Locate the following statement:
JAVAAppend the following sink after the statement and before
env.execute().JAVAThe sink writes tumbling-window results to Kafka transactions. Flink commits each transaction only after the corresponding checkpoint completes. Consumers using the
read_committedisolation level do not receive records from aborted transactions.Save and close the file.
The application:
- Uses exactly-once checkpoints to maintain consistent state.
- Writes window results to the
flink-window-resultstopic. - Commits Kafka transactions after successful checkpoints.
- Aborts incomplete transactions during recovery.
- Allows consumers configured with the
read_committedisolation level to ignore uncommitted and aborted records.
Build the application.
CONSOLEVerify that Maven compiled the application for Java 11.
CONSOLEThe output shows
major version: 55, which corresponds to Java 11.Verify that the JAR bundles the Kafka connector classes.
CONSOLEThe output lists the
KafkaSinkandKafkaSourceclasses, which confirms the connector is shaded into the JAR.
Deploy the Updated Flink Application
The Maven build stores the updated JAR on the local computer. Upload and run the JAR on the Flink Session Cluster.
Verify that the Flink REST service exists.
CONSOLEForward local port 8081 to the Flink REST service.
CONSOLEStore the port-forward process ID.
CONSOLEWait for the Flink REST endpoint.
CONSOLEUpload the application JAR.
CONSOLEDisplay the upload response.
CONSOLEOutput:
Extract the uploaded JAR identifier.
CONSOLEVerify the JAR identifier.
CONSOLEOutput:
Submit the event-time application.
CONSOLEDisplay the submission response.
CONSOLEOutput:
Extract the Flink job ID.
CONSOLEVerify the job ID.
CONSOLEOutput:
Check the application state.
CONSOLEOutput:
A
RUNNINGstate confirms that Flink submitted the application successfully and started its processing tasks.Stop port forwarding.
CONSOLEStopping the local port-forward does not stop the Flink job. It only closes the local connection to the Flink REST service.
Run Apache Beam Pipelines on Flink
Apache Beam separates pipeline code from the processing engine that runs it. The Flink Runner translates a Beam pipeline into a Flink job and submits it to an existing Flink cluster.
Create the Apache Beam Project
Switch to the main project directory.
CONSOLECreate a Maven project for the Beam pipeline.
CONSOLESwitch to the Beam project directory.
CONSOLECreate the Maven project configuration.
CONSOLEAdd the following configuration.
XMLThe configuration:
- Java 11 keeps the application compatible with the Flink cluster.
- The Beam SDK provides the pipeline API and transforms.
- The Flink Runner submits Beam pipelines to Flink 1.20.x.
- SLF4J provides command-line logging for the Beam client.
- The Maven Shade plugin creates a runnable JAR with the required dependencies.
- The transformers set the main class and preserve the service files required by Beam.
Save and close the file.
Create the Beam Pipeline
Create the Beam application.
CONSOLEAdd the following application.
JAVAThe pipeline:
- Creates a bounded collection of text records.
- Splits each record into words.
- Counts each word.
- Formats the word-count results.
- Waits until the bounded pipeline finishes.
Save and close the file.
Build the Beam Pipeline
Build the application JAR.
CONSOLEThe Maven Shade plugin may display warnings about overlapping manifests, licenses, classes, and metadata. The build is successful when Maven returns:
Verify that Maven created the application JAR.
CONSOLEOutput:
Verify that Maven compiled the application for Java 11.
CONSOLEOutput:
Verify that the application JAR contains the Flink Runner.
CONSOLEOutput:
Configure the Flink Runner
Verify that the Flink Session Cluster REST service exists.
CONSOLEForward local port 8081 to the Flink REST service.
CONSOLEStore the port-forward process ID.
CONSOLEWait for the Flink REST endpoint.
CONSOLE
Submit the Beam Pipeline
Create a unique identifier for the submission.
CONSOLECreate a unique Beam job name.
CONSOLEVerify the generated job name.
CONSOLEOutput:
Submit the pipeline through the Flink Runner.
CONSOLENote
Do not stop the command with Ctrl+C. The Beam client translates the pipeline, submits it to Flink, and waits for the bounded job to finish.
Extract the Flink job ID from the submission log.
CONSOLEVerify the job ID.
CONSOLEOutput:
Verify the Beam Pipeline
Verify the name of the submitted job.
CONSOLECheck the job state.
CONSOLEOutput:
A
FINISHEDstate confirms that the Flink Runner translated and executed the bounded Beam pipeline successfully.Stop port forwarding.
CONSOLE
Set Up Monitoring and Observability
Prometheus collects metrics from Flink components and stores them as time-series data. Grafana uses these metrics to display dashboards, while Alertmanager processes alerts generated by Prometheus.
Install Prometheus and Grafana
Create a namespace for the monitoring resources.
CONSOLEAdd the Prometheus Community Helm repository.
CONSOLEUpdate the Helm repository information.
CONSOLEInstall the
kube-prometheus-stackHelm chart.CONSOLENote
Do not stop the installation with Ctrl+C. The chart installs multiple workloads and Custom Resource Definitions and may take several minutes to complete.
Note
This article pins version
72.0.0. If you change the version, confirm the Grafana sidecar loads dashboards, because some newer chart releases ship a sidecar image that fails TLS verification against the Kubernetes API server and silently loads no dashboards. Check the chart releases for the latest version.The
kube-prometheus-stackchart installs Prometheus Operator, Prometheus, Alertmanager, Grafana, Kubernetes metrics exporters, dashboards, and alerting rules.Verify the Helm release.
CONSOLEVerify the monitoring pods.
CONSOLEOutput:
Verify that the Prometheus Operator Custom Resource Definitions exist.
CONSOLEOutput:
Enable the Prometheus Reporter in Flink
The Flink Prometheus reporter exposes JobManager and TaskManager metrics in a format that Prometheus can collect. The Flink image used by the Session Cluster already includes the Prometheus metrics plugin.
Verify that the Prometheus reporter JAR exists.
CONSOLEOutput:
Configure the Session Cluster to expose Prometheus metrics on port 9249.
CONSOLEThe configuration:
- Enables the Prometheus reporter in the Flink Session Cluster.
- Uses port 9249 for the metrics endpoint.
- Adds a named metrics port to the JobManager and TaskManager containers.
- Preserves the existing checkpointing and resource settings.
Flink loads metric reporters through the
metrics.reporter.<name>.factory.classsetting. The Prometheus reporter exposes a pull-based endpoint and uses port 9249 by default.Wait for the
FlinkDeploymentto become stable.CONSOLEVerify that the Session Cluster pods are running.
CONSOLEOutput:
Verify the reporter configuration.
CONSOLEOutput:
Verify that the Flink pods expose the metrics port.
CONSOLEOutput:
Test the Prometheus endpoint on each Flink pod.
CONSOLE
Configure Prometheus Scraping
A ServiceMonitor-based configuration requires a Kubernetes Service to discover the Flink metrics endpoints. The ServiceMonitor then instructs the Prometheus Operator to scrape the named metrics port exposed by that Service.
Create a metrics Service manifest.
CONSOLEAdd the following configuration.
YAMLThe Service:
- Selects the Session Cluster JobManager and TaskManager pods.
- Exposes the Flink Prometheus endpoint on port 9249.
- Uses the named metrics container port configured earlier.
- Uses a headless Service so Prometheus can discover each Flink pod as a separate target.
Save and close the file.
Create the metrics Service.
CONSOLEVerify the Service.
CONSOLEOutput:
Verify that the Service discovered the Flink pods.
CONSOLEOutput:
Create a ServiceMonitor manifest.
CONSOLEAdd the following configuration.
YAMLThe
ServiceMonitor:- Discovers the Flink metrics Service in the
flinknamespace. - Selects the Service using the
monitoring: flinklabel. - Scrapes the named metrics port every 30 seconds.
- Uses the
release: monitoringlabel so Prometheus selects the resource.
Save and close the file.
- Discovers the Flink metrics Service in the
Create the ServiceMonitor.
CONSOLEVerify the ServiceMonitor.
CONSOLEOutput:
Verify that its selector matches the metrics Service.
CONSOLEOutput:
Wait for Prometheus to discover the new targets.
CONSOLEForward local port 9090 to the Prometheus Service.
CONSOLEStore the port-forward process ID.
CONSOLEWait for the Prometheus API.
CONSOLEQuery the Flink scrape targets.
CONSOLEA value of
"1"confirms that the target is reachable and healthy.Verify that Prometheus stores Flink metrics.
CONSOLEA value greater than zero confirms that Prometheus is collecting Flink metrics.
Stop port forwarding.
CONSOLE
Access Grafana and Verify Prometheus
Grafana visualizes the Flink metrics stored in Prometheus. The monitoring stack includes a preconfigured Prometheus data source, so Grafana can query the metrics without requiring an additional connection.
Retrieve the Grafana administrator password.
CONSOLEDisplay the password.
CONSOLECopy the displayed password. Use it to sign in to Grafana.
Forward local port 3000 to the Grafana service.
CONSOLEStore the port-forward process ID.
CONSOLEWait until Grafana becomes available.
CONSOLEVerify the Grafana health status.
CONSOLEOutput:
JSONOpen
http://localhost:3000in a web browser. The Grafana login screen appears.Sign in using the following credentials:
- Username:
admin - Password: The value displayed by the
echo "$GRAFANA_PASSWORD"command.
- Username:
Verify that the Prometheus data source is available.
CONSOLERetrieve the actual Prometheus data source UID.
CONSOLEQuery the Flink targets using the Prometheus data source UID.
CONSOLE
Deploy a Flink Grafana Dashboard
Create a Grafana dashboard for Flink availability, failed checkpoints, job restarts, and backpressure. Store it in a labeled Kubernetes ConfigMap so Grafana loads it automatically.
Create the dashboard manifest.
CONSOLEAdd the following configuration.
YAMLThe dashboard:
- Displays the availability of the Flink JobManager and TaskManager targets.
- Displays the failed checkpoints and job restarts reported by the running Flink jobs.
- Displays the highest backpressure value reported by a Flink task.
- Refreshes the dashboard every 30 seconds.
Save and close the file.
Create the dashboard ConfigMap.
CONSOLEVerify the ConfigMap.
CONSOLEOutput:
Verify that the dashboard label exists.
CONSOLEOutput:
Wait for the Grafana dashboard sidecar to load the dashboard.
CONSOLEVerify that Grafana registered the dashboard.
CONSOLEOpen the following URL in a web browser.
HTTPThe Apache Flink Monitoring dashboard appears with panels for target availability, failed checkpoints, job restarts, and backpressure.
Configure Flink Alerts
Create Prometheus alerting rules for failed checkpoints, job restarts, and sustained backpressure. Prometheus evaluates these rules and sends active alerts to Alertmanager.
Create the alert rules manifest.
CONSOLEAdd the following configuration.
YAMLThe alert rules:
- Detect a failed checkpoint recorded during the last 10 minutes.
- Detect a Flink job restart recorded during the last 10 minutes.
- Detect task backpressure above 500 milliseconds per second for five minutes.
- Use the
release: monitoringlabel so Prometheus selects the resource.
The
backPressuredTimeMsPerSecondmetric reports how many milliseconds during each second a task spent under backpressure. A value above 500 means the task remained backpressured for more than half of the measured period.Save and close the file.
Create the
PrometheusRule.CONSOLEVerify the alert rules resource.
CONSOLEOutput:
Verify the rule group and alert names.
CONSOLEOutput:
Forward local port 9090 to Prometheus.
CONSOLEStore the port-forward process ID.
CONSOLEWait until Prometheus becomes available.
CONSOLEVerify that Prometheus loaded the Flink rules.
CONSOLEOutput:
Stop the Prometheus port-forward process.
CONSOLEStop the Grafana port-forward process.
CONSOLE
Configure High Availability
Enable the S3 Filesystem Plugin
Flink requires an S3 filesystem plugin to access Object Storage paths. The Flink image includes the S3 plugin in the /opt/flink/opt directory, but Flink only loads plugins from /opt/flink/plugins.
Verify that the Object Storage credentials secret exists.
CONSOLEOutput:
Verify that the Flink image includes the S3 filesystem plugin.
CONSOLEOutput:
Configure an init container that copies the existing Flink plugins and the S3 filesystem plugin into a shared volume.
CONSOLEThe configuration:
- Copies the existing Flink plugins into a shared volume.
- Adds the S3 filesystem plugin to the active plugin directory.
- Loads the Object Storage credentials from the existing Kubernetes Secret.
- Applies the plugin configuration to the JobManager and TaskManager pods.
Wait for the Session Cluster to become stable.
CONSOLEVerify that the S3 filesystem plugin is available in the active plugin directory.
CONSOLEOutput:
Verify that the Prometheus plugin remains available.
CONSOLEOutput:
Verify that the Object Storage credentials are loaded without displaying their values.
CONSOLEOutput:
Configure Kubernetes High Availability
Kubernetes high availability uses Kubernetes ConfigMaps for leader election. The configuration runs two JobManager replicas and stores recovery metadata in Object Storage so a standby JobManager can restore the cluster state after the active JobManager fails.
Configure high availability on the Session Cluster. Replace
YOUR_BUCKET_NAMEwith your Object Storage bucket name andYOUR_OBJECT_STORAGE_HOSTNAMEwith your Object Storage hostname without thehttps://prefix.CONSOLEThe configuration:
- Enables Kubernetes-based high availability.
- Stores recovery metadata in the
YOUR_BUCKET_NAMEObject Storage bucket. - Connects Flink to the S3-compatible Object Storage endpoint.
- Runs two JobManager replicas for leader and standby roles.
Wait for the Session Cluster to become stable.
CONSOLEVerify the high-availability configuration.
CONSOLEOutput:
Verify the JobManager deployment status.
CONSOLEOutput:
Verify the JobManager pods.
CONSOLEOutput:
Verify the ConfigMaps used for high-availability coordination.
CONSOLEOutput:
Verify JobManager Pod Recovery
Delete one JobManager pod to verify that Kubernetes restores the replica count and that the Flink REST service becomes available after the pod is replaced.
Store the name of one JobManager pod.
CONSOLEDisplay the stored pod name.
CONSOLEOutput:
Delete the selected JobManager pod.
CONSOLEWait for the JobManager Deployment to restore both replicas.
CONSOLEVerify the JobManager pods.
CONSOLEOutput:
The newer pod replaces the deleted JobManager replica.
Verify that the
FlinkDeploymentremains stable.CONSOLEOutput:
Forward local port 8081 to the Flink REST service.
CONSOLEKeep this terminal open. Open a second terminal and query the cluster overview.
CONSOLEA successful response confirms that the Session Cluster REST endpoint is available after Kubernetes replaces the deleted JobManager pod.
Configure Checkpoint Recovery
Store checkpoints and savepoints in Object Storage so Flink can recover job state after a pod failure.
Configure Object Storage as the checkpoint and savepoint location. Replace
YOUR_BUCKET_NAMEwith your Object Storage bucket name.CONSOLEThe configuration:
- Removes the local checkpoint and savepoint paths.
- Stores checkpoint data in Object Storage.
- Stores savepoints in a separate Object Storage path.
- Retains externalized checkpoints when a job is canceled.
- Keeps the three most recent completed checkpoints.
Wait for the Session Cluster to become stable.
CONSOLEVerify the checkpoint recovery configuration.
CONSOLEOutput:
Verify that the local checkpoint and savepoint settings were removed.
CONSOLEThe command returns two empty lines.
Forward local port 8081 to the Flink REST service.
CONSOLEKeep this terminal open. Open a second terminal and submit a long-running example job.
CONSOLEDisplay the submission result.
CONSOLEThe output includes the submitted job ID.
Store the job ID.
CONSOLEVerify the stored job ID.
CONSOLEWait for Flink to complete at least one checkpoint.
CONSOLEQuery the latest completed checkpoint.
CONSOLEOutput:
Cancel the example job after verification.
CONSOLEReturn to the first terminal and press Ctrl+C to stop port forwarding.
Configure Security
Configure Namespace-Scoped RBAC
The Flink JobManager uses the flink service account to manage TaskManager pods and high-availability ConfigMaps. Create namespace-scoped permissions so the service account can manage these resources only in the flink namespace.
Verify that the Flink service account exists.
CONSOLEOutput:
Create an RBAC manifest.
CONSOLEAdd the following configuration.
YAMLThe configuration:
- Grants access only in the
flinknamespace. - Allows the JobManager to manage TaskManager pods and high-availability ConfigMaps.
- Allows Flink to manage the Kubernetes Deployment used by the Session Cluster.
- Binds the permissions to the existing
flinkservice account.
Save and close the file.
- Grants access only in the
Create the Role and RoleBinding.
CONSOLEVerify that the RoleBinding references the
flink-runtimeRole.CONSOLEOutput:
Verify that the service account can create TaskManager pods in the
flinknamespace.CONSOLEOutput:
Verify that the same permission does not apply in the
defaultnamespace.CONSOLEOutput:
Protect Object Storage Credentials
Store Object Storage credentials in a Kubernetes Secret instead of adding them directly to the FlinkDeployment. The Session Cluster loads the Secret values as environment variables without displaying the credential values in the deployment configuration.
Verify that the Secret contains the required keys without displaying their values.
CONSOLEOutput:
Verify that the Session Cluster references the Object Storage Secret.
CONSOLEOutput:
Restrict Flink Network Access
Apply a Kubernetes NetworkPolicy to control inbound and outbound traffic for the Session Cluster. The policy allows Flink component communication, Prometheus metrics collection, Kafka access, DNS queries, and outbound HTTPS connections.
Verify that the Kubernetes NetworkPolicy API is available.
CONSOLEOutput:
Note
The NetworkPolicy API may be available even when the cluster network plugin does not enforce NetworkPolicy resources. Verify that your cluster uses a compatible network plugin before relying on the policy for traffic isolation.
Create a NetworkPolicy manifest.
CONSOLEAdd the following configuration.
YAMLThe policy:
- Allows communication between Flink pods and other pods in the
flinknamespace. - Allows pods in the
monitoringnamespace to collect Prometheus metrics on port 9249. - Allows Flink jobs to connect to services in the
kafkanamespace on port 9092. - Allows DNS queries to the cluster DNS pods.
- Allows outbound HTTPS connections on port 443, including connections to Object Storage.
Save and close the file.
- Allows communication between Flink pods and other pods in the
Create the NetworkPolicy.
CONSOLEVerify the NetworkPolicy.
CONSOLEOutput:
Wait for the Session Cluster to remain stable.
CONSOLEVerify that the JobManager and TaskManager pods remain ready.
CONSOLEOutput:
Verify the Deployment
Verify the Flink Cluster Status
Verify the Session Cluster resources and confirm that the configured processing capacity is available.
Verify that the Session Cluster has reached the stable state.
CONSOLEOutput:
The empty third line confirms that the
FlinkDeploymentdoes not report an error.Verify the JobManager and TaskManager pods.
CONSOLEOutput:
Verify the Flink services.
CONSOLEOutput:
Verify the configured TaskManager replicas and task slots.
CONSOLEOutput:
The Session Cluster runs two TaskManager replicas with two task slots each, providing four task slots in total.
Produce Test Events
Create a temporary Kafka client pod and produce timestamped events to the flink-events topic.
Create a temporary Kafka client pod.
CONSOLEWait for the pod to become ready.
CONSOLECreate a timestamp aligned with the current minute.
CONSOLEProduce test events to the
flink-eventstopic.CONSOLEThe producer uses
testas the Kafka record key. Each record value contains the event type, numeric value, and event-time timestamp. The final record advances event time so Flink can complete the earlier window.
Verify Window Results
Wait for the one-minute window and the next checkpoint to complete.
CONSOLERead committed results from the output topic.
CONSOLEConfirm that the consumer displays the aggregated
checkoutandpaymentevents. Theread_committedisolation level hides incomplete and aborted Kafka transactions.
Test Failure Recovery
Delete a TaskManager pod to simulate a failure, and verify that Kubernetes replaces the pod and Flink returns the streaming job to the RUNNING state.
Store the name of a running TaskManager pod.
CONSOLEDelete the TaskManager pod to simulate a failure.
CONSOLEWait for two TaskManager pods to reach the
Runningstate.CONSOLEVerify that the replacement TaskManager pod is running.
CONSOLEForward local port 8081 to the Flink REST service.
CONSOLEStore the port-forward process ID.
CONSOLEWait for the REST endpoint to become available.
CONSOLERetrieve the running Flink job ID.
CONSOLEVerify the job ID.
CONSOLEVerify that the Flink job returned to the
RUNNINGstate.CONSOLEStop port forwarding.
CONSOLEDelete the temporary Kafka client pod.
CONSOLE
Migrate from GCP Dataflow to Apache Flink
Migrating from GCP Dataflow to Apache Flink involves changing the pipeline runner, replacing Google Cloud-specific services, and adapting deployment, state, scaling, and monitoring workflows to Kubernetes.
Beam Pipeline Migration
Apache Beam pipelines can run on Flink when they use Beam-portable transforms and connectors.
- Migration: Replace
DataflowRunnerwithFlinkRunnerin the pipeline options. - Connector changes: Replace Google Cloud-specific sources and sinks, such as Pub/Sub, BigQuery, and GCS connectors, with portable alternatives such as Kafka, JDBC-compatible databases, and Object Storage.
- Validation: Run the pipeline locally or on a test Flink Session Cluster before migrating production workloads. Verify serialization, dependency packaging, parallelism, and event-time behavior.
Stateful Pipeline Migration
Dataflow state cells and timers must be reviewed before moving stateful processing to Flink.
- Migration: Map per-key Dataflow state to Flink keyed state, such as
ValueState,ListState,MapState, orReducingState. - State access: Apply
keyBy()before accessing keyed state and confirm that the selected key produces the same state partitioning used by the Dataflow pipeline. - Recovery: Configure durable checkpoints and savepoints before migrating stateful production jobs. Test application restarts and upgrades using representative state volumes.
Windowing and Trigger Migration
Apache Beam window definitions are portable, but runner-specific timing behavior may differ.
- Migration: Retain compatible tumbling, sliding, and session window assignments when moving Beam pipelines to the Flink Runner.
- Late data: Verify watermarks, allowed lateness, accumulation modes, and side outputs using delayed and out-of-order events.
- Triggers: Test processing-time, event-time, and composite triggers because firing frequency and pane timing can differ between runners.
Template and Scheduling Migration
Dataflow Templates package reusable pipelines for repeatable execution.
- Migration: Replace Dataflow Templates with versioned Flink application JARs or container images.
- Deployment: Submit reusable jobs through
FlinkSessionJobresources, the Flink REST API, or dedicatedFlinkDeploymentapplication clusters. - Scheduling: Replace Cloud Scheduler-based submissions with Kubernetes CronJobs or an external workflow orchestrator such as Apache Airflow.
Data Storage Considerations
Dataflow workloads commonly depend on Google Cloud storage and messaging services.
- Google Cloud Storage: Migrate pipeline files, checkpoints, and intermediate data to S3-compatible Object Storage. Update storage paths, endpoints, and credentials in the Flink configuration.
- Pub/Sub: Replace Pub/Sub sources and sinks with Kafka topics when the workload requires portable event streaming.
- BigQuery: Replace BigQuery sinks with a compatible database, data warehouse, JDBC destination, or Object Storage format based on the workload requirements.
- Credentials: Replace Google service-account credentials with Kubernetes Secrets, workload-specific service accounts, and storage access keys.
Things to Take Care During Migration
- Google Cloud connectors: Beam connectors designed specifically for GCP may not work with the Flink Runner without replacement or additional configuration.
- Autoscaling: Dataflow manages worker scaling automatically. Flink requires Reactive Mode, Kubernetes Horizontal Pod Autoscaling, or operator-managed scaling policies.
- Streaming Engine: Dataflow Streaming Engine optimizations do not have a direct Flink equivalent. Re-evaluate memory, network, state backend, and checkpoint settings.
- Access control: Replace Google Cloud IAM roles with Kubernetes RBAC, namespace permissions, service accounts, and external storage policies.
- Monitoring: Replace Cloud Monitoring and Dataflow metrics with Prometheus, Grafana, Flink metrics, and Kubernetes alerts.
- Large state: Tune checkpoint intervals, timeouts, incremental checkpoints, state backend storage, and restart strategies before migrating workloads with large state.
- Parallelism: Dataflow worker counts do not map directly to Flink parallelism. Benchmark source partitions, task slots, operator parallelism, and backpressure before production migration.
- Delivery guarantees: Verify that every source and sink supports the required delivery guarantee. End-to-end exactly-once processing requires checkpoint-compatible sources and transactional or idempotent sinks.
Conclusion
You have successfully deployed Apache Flink on Kubernetes Engine as a self-hosted alternative to GCP Dataflow. The deployment includes Session and Application Clusters, durable state management with Object Storage, event-time windowing, exactly-once Kafka processing, Apache Beam pipelines, Prometheus and Grafana monitoring, high availability, security controls, and migration guidance for existing Dataflow workloads. For more information, refer to the official Apache Flink documentation and the official Apache Flink Kubernetes Operator documentation.


0 Comments
Be the first to comment and share your perspective with the community.