How to Deploy Lustre as an AWS FSx Alternative
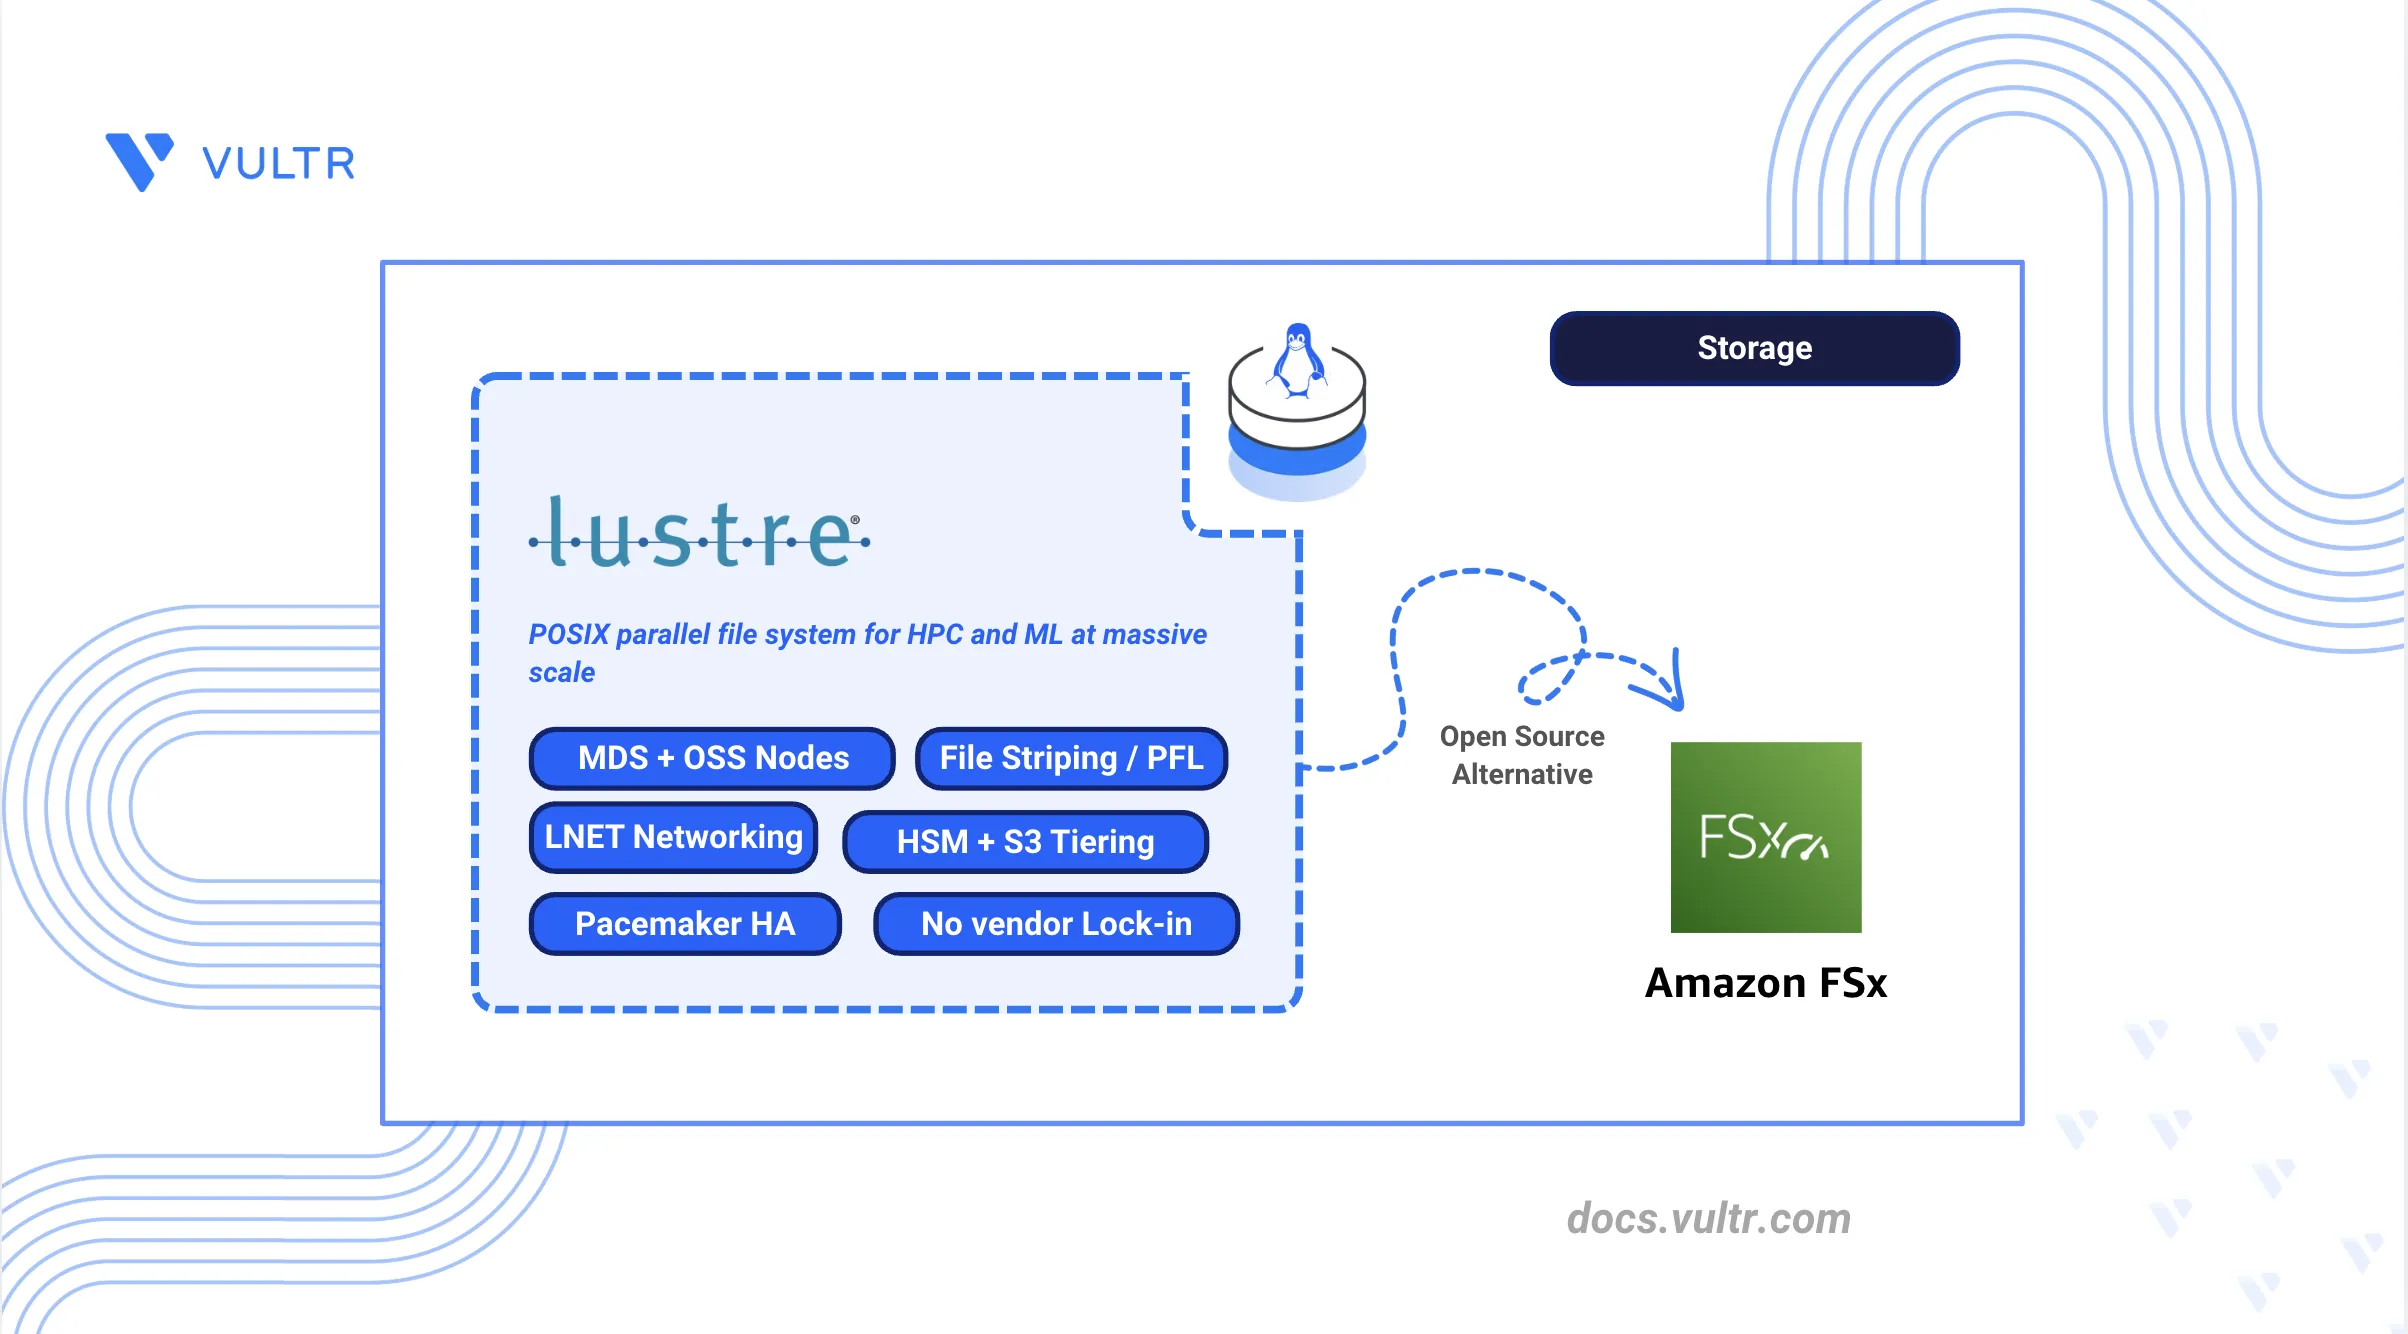
AWS FSx for Lustre is Amazon's fully managed parallel file system service for high-performance computing and machine learning workloads. It provides SSD and Intelligent-Tiering storage classes, native Amazon S3 integration, per-client throughput of up to 1,200 Gbps, and automatic capacity scaling as a hosted service inside the AWS ecosystem. It removes the need to operate metadata and object storage servers, but it charges per TiB of provisioned capacity regardless of utilization, limits throughput and deployment options to the tiers AWS exposes, and ties both the file system and its clients to AWS regions, VPCs, and IAM.
Lustre is the open-source, POSIX-compliant parallel distributed file system that FSx for Lustre is built on, and it runs the same way on self-hosted infrastructure without per-TiB billing or AWS API dependencies. It is designed for high-performance computing (HPC), machine learning training, and large-scale data processing, and it separates file metadata from file data and distributes each across dedicated server nodes, which delivers aggregate throughput that scales linearly as you add storage targets. A self-hosted deployment also gives you direct control over striping layouts, LNET network configuration, quota policy, and the underlying storage hardware.
This article explains how to deploy Lustre as an alternative to AWS FSx for Lustre. It covers the Lustre package installation, metadata and object storage server deployment, client mounts, striping and Progressive File Layouts (PFL), LNET networking, quotas and POSIX access control lists (ACLs), monitoring with Prometheus and Grafana, high availability with Pacemaker, benchmarking with IOR and mdtest, and migration from AWS FSx for Lustre.
Understanding Lustre Architecture
Lustre separates file metadata from file data and distributes each across dedicated servers. The Metadata Server (MDS) hosts the Metadata Target (MDT), which stores filenames, directory structure, permissions, and stripe layout information. Object Storage Server (OSS) nodes host Object Storage Targets (OSTs) that store the actual file data. Clients communicate directly with both the MDS and the OSS nodes through the LNET network protocol, so file data flows in parallel across multiple OSTs without passing through a central gateway.
The following table maps each AWS FSx for Lustre feature to its self-hosted Lustre equivalent:
Prerequisites
Before you begin, you need to:
- Have access to at least three Linux-based servers as a non-root user with sudo privileges: one Metadata Server (MDS) and two Object Storage Servers (OSS).
- Have access to a separate Linux-based server as a non-root user with sudo privileges to act as the client that mounts the file system.
- Attach a dedicated Block Storage volume to the MDS for the Metadata Target (at least 10 GB) and to each OSS node for an Object Storage Target (at least 20 GB per OSS).
- Connect all nodes over a private VPC for the Lustre network (10 GbE minimum, with InfiniBand recommended for production HPC workloads).
- Have basic Linux storage administration knowledge, including kernel module loading and matching
kernel-develpackages to the running kernel.
Install Lustre Packages
Lustre 2.15 LTS requires a kernel that the Whamcloud project patched and rebuilt with Lustre-specific changes. Whamcloud publishes pre-built packages for Enterprise Linux 8 and 9 and for Ubuntu. This article installs the Enterprise Linux 8 build, which runs on Rocky Linux 8, AlmaLinux 8, and RHEL 8, and pulls the patched kernel and modules directly from the Whamcloud repository. For a different distribution, select the matching repository from the Whamcloud download site and adjust the package names accordingly.
Add the Lustre Repository
The Whamcloud repository serves the Lustre server packages, the matching client packages, and the patched e2fsprogs package that provides Lustre-specific file system utilities.
Open a repository configuration file on each MDS, OSS, and client node.
CONSOLEAdd the following configuration.
INISave and close the file.
lustre-server: Provides the server-side packages, including the patched kernel, kernel modules, and management utilities.lustre-client: Provides the client-side kernel modules and userspace utilities such aslfs.e2fsprogs-wc: Provides the Whamcloud-builte2fsprogspackage that supports the Lustre LDISKFS backend.
Install Server Packages
Run the following steps on the MDS and on both OSS nodes.
Install the EPEL repository, which provides several dependencies.
CONSOLEInstall the Lustre-patched kernel and matching kernel headers.
CONSOLESet the patched kernel as the default boot kernel.
CONSOLEInstall the Whamcloud-built
e2fsprogs.CONSOLEInstall the Lustre server packages.
CONSOLEPin the kernel version to prevent automatic updates from breaking Lustre.
CONSOLENote
The kernel pin is essential. Lustre server modules build against a specific kernel version, and automatic updates from the regular distribution repositories install kernels that the Lustre modules cannot load against, which breaks the cluster on the next reboot.
Reboot the node into the patched kernel.
CONSOLEWait approximately 60 seconds for the node to reboot, then reconnect over SSH.
Confirm the running kernel after reconnecting.
CONSOLEThe output displays the Lustre-patched kernel.
Load the Lustre kernel module.
CONSOLEConfirm that the modules load correctly.
CONSOLEThe output lists the
lustre,lnet,obdclass, and related modules.
Install Client Packages
Run the following steps on the client node only. The client uses the stock distribution kernel and does not require the patched kernel.
Install the EPEL repository.
CONSOLEInstall the Lustre client packages.
CONSOLELoad the Lustre kernel module.
CONSOLEVerify that the client modules load.
CONSOLEPin the kernel version to prevent automatic updates from breaking the client module.
CONSOLE
Open the Lustre Network Port
Lustre nodes communicate over LNET on TCP port 988. Enterprise Linux enables firewalld by default, which blocks this port and prevents the OSS nodes and clients from reaching the MGS. Complete the following steps on every MDS, OSS, and client node.
Allow the LNET port through the firewall.
CONSOLEReload the firewall to apply the rule.
CONSOLE
Important
By default, LNET uses each server's primary network interface, which is the public interface on Vultr instances. The MGS registers its network identifier (NID) on that interface, so the MDS-IP-ADDRESS you use to format OSTs and mount clients must match it. To route Lustre traffic over the private VPC instead, configure LNET on every node before you format any target. Create /etc/modprobe.d/lustre.conf with options lnet networks=tcp0(INTERFACE), replacing INTERFACE with the VPC interface name from ip addr (for example, enp8s0), then reboot the node. Use the node's VPC address as MDS-IP-ADDRESS throughout this article.
Deploy the Metadata Server
The Metadata Server hosts the Management Server (MGS) and Metadata Target (MDT) roles in this deployment, which collocates them on the same node. The MGS coordinates file system registration for OSTs and clients, and the MDT stores the namespace and stripe layout information for the entire file system.
Identify the dedicated block device on the MDS.
CONSOLEThe output lists all attached disks. On Vultr, block storage uses virtio device names: the operating system occupies
/dev/vdaand the dedicated MDT volume appears as/dev/vdb. Use the device name shown in your own output in the commands that follow.Format the device as the combined MGS and MDT. Replace
lustrefswith your chosen file system name and/dev/vdbwith your MDT device.CONSOLECreate the mount point.
CONSOLEMount the MDT.
CONSOLEVerify that the MDS services are running.
CONSOLEThe output lists the active devices, including
mgs,mds,mdt, andosd-ldiskfs.
Deploy Object Storage Servers
Each OSS hosts one OST that stores file data. The MGS coordinates the registration of OSTs with the file system, and clients communicate directly with each OSS for I/O. This deployment provisions one OST per OSS node with sequential indexes that the MGS uses to distinguish each target.
Configure the First OSS
Run the following steps on the first OSS node.
Identify the dedicated block device.
CONSOLEFormat the device as an OST that points to the MGS. Replace
MDS-IP-ADDRESSwith the MDS address on the Lustre network and/dev/vdbwith your OST device.CONSOLECreate the mount point.
CONSOLEMount the OST.
CONSOLEVerify the OSS services.
CONSOLEThe output lists
obdfilter,ost, and the connection to the MGS through themgcdevice.
Configure the Second OSS
Run the following steps on the second OSS node. The second OSS uses index 1 so that the MGS distinguishes it from the first OST.
Format the device with index
1. ReplaceMDS-IP-ADDRESSwith the MDS address on the Lustre network.CONSOLECreate the mount point for the second OST.
CONSOLEMount the second OST.
CONSOLESwitch to the MDS node and verify that both OSTs register successfully.
CONSOLEThe output lists both OSTs in the
FULLstate.
Mount the File System on Clients
The client connects to the file system through the MGS network address. After mounting, applications interact with the file system through standard POSIX system calls, so existing FSx workloads run without code changes.
Create the mount point on the client node.
CONSOLEMount the file system. Replace
MDS-IP-ADDRESSwith the MDS address on the Lustre network andlustrefswith your file system name.CONSOLEVerify the mount and view the aggregate capacity.
CONSOLEView per-target capacity and usage.
CONSOLEThe output lists each MDT and OST separately, which helps identify imbalances and full targets.
Run a write test to confirm functionality.
CONSOLEThe command reports the achieved write throughput.
Remove the test file.
CONSOLE
Configure Striping and File Layouts
Striping distributes a single file across multiple OSTs, which delivers aggregate throughput beyond what a single storage target provides. Progressive File Layouts (PFL) apply different stripe counts to different file size ranges, which optimizes both small and large files in the same file system. PFL is the self-hosted equivalent of FSx Intelligent-Tiering at the layout level. Run the following steps on the client node.
Set a Default Stripe Layout
A uniform stripe configuration applies the same stripe count to every file in a directory.
Create a directory for striped files.
CONSOLESet the stripe count to 2 and the stripe size to 1 MiB.
CONSOLE-c 2: Stripes each file across 2 OSTs.-S 1M: Sets the stripe size to 1 MiB, so Lustre writes 1 MiB to one OST before moving to the next.
Verify the stripe configuration.
CONSOLEThe output reports
stripe_count: 2andstripe_size: 1048576.
Configure Progressive File Layouts
PFL adjusts the stripe count automatically based on file size, which improves performance for mixed workloads.
Create a directory for PFL files.
CONSOLEApply a three-tier PFL.
CONSOLE-E 4M -c 1: Files up to 4 MiB use a single stripe, which avoids OST overhead for small files.-E 64M -c 2: Files up to 64 MiB use 2 stripes.-E -1 -c 2: Files larger than 64 MiB use 2 stripes for the remaining extents.
Confirm the PFL configuration.
CONSOLEThe output lists each tier with its extent boundaries and stripe count.
Set Up Networking with LNET
LNET is the network abstraction layer that Lustre uses for client-server and server-server communication. The default configuration uses TCP over the interface you set in the Open the Lustre Network Port section. Multi-rail configurations bond multiple interfaces for redundancy or aggregate bandwidth, while InfiniBand deployments use the o2ib transport instead of tcp. Run the following steps on the client node.
Display the current LNET configuration.
CONSOLEThe output shows the active networks, including the loopback (
lo) and the primary TCP interface (tcp).View detailed LNET tunables.
CONSOLEThe output exposes per-network statistics for sent and received packets along with the current peer credit configuration.
Test peer connectivity from the client to the MDS. Replace
MDS-IP-ADDRESSwith the MDS address on the Lustre network.CONSOLEA successful response confirms that LNET routes traffic to the MDS correctly.
Configure Quotas and Access Control
Quotas enforce per-user and per-group capacity limits across the file system, while POSIX ACLs provide fine-grained file and directory permissions beyond the standard owner-group-other modes.
Enable Quotas
Lustre enforces quotas at both the MDT and OST levels, with separate limits for blocks (capacity) and inodes (file count).
Enable user and group quotas on the MDT from the MDS node.
CONSOLEEnable user and group quotas on the OSTs from the MDS node.
CONSOLE
Apply Quota Limits
Quota limits use soft and hard ceilings: the soft limit triggers a warning grace period, and the hard limit blocks further writes.
Set quota limits for a specific user from the client. Replace
USER-NAMEwith the target Linux username.CONSOLE-b 100M: Soft block limit (100 MiB).-B 200M: Hard block limit (200 MiB).-i 10000: Soft inode limit (10,000 files).-I 20000: Hard inode limit (20,000 files).
View the quota usage and limits.
CONSOLE
Configure POSIX ACLs
POSIX ACLs grant fine-grained permissions to additional users or groups beyond the standard owner-group-other model. Run the following steps on the client node.
Create a directory for the ACL test.
CONSOLEApply an ACL that grants read, write, and execute permissions to the
nobodyuser.CONSOLEVerify the ACL.
CONSOLEThe output lists the standard POSIX permissions and the additional
user:nobody:rwxentry.
Set Up Monitoring
Lustre exposes detailed performance metrics through the lctl interface. The lustre_exporter translates those metrics into Prometheus format, and Grafana visualizes them through dashboards. The combination provides the self-hosted equivalent of CloudWatch metrics for FSx.
Enable Jobstats
Jobstats track per-job I/O statistics across the cluster, which makes it possible to attribute throughput and operation rates to specific applications.
Enable jobstats on the MDS.
CONSOLEEnable jobstats on the client.
CONSOLEThe
procname_uidvalue tags each I/O operation with the originating process name and user ID, which produces job entries such asdd.0forddrun by user0(root).
Build the Lustre Exporter
Run the following steps on the MDS. The Lustre exporter is a Go binary that the GSI-HPC community maintains.
Install the build dependencies.
CONSOLEClone the exporter repository into your home directory.
CONSOLEEnter the cloned directory.
CONSOLEBuild the binary. The
GOTOOLCHAIN=autosetting allows Go to download a newer toolchain if the source requires it.CONSOLEVerify that the binary exists.
CONSOLE
Install the Exporter as a Service
A systemd service keeps the exporter running across reboots and restarts it on failure.
Copy the binary to the system path.
CONSOLECreate the systemd unit file.
CONSOLEAdd the following content.
INISave and close the file. The exporter listens on port
9169by default.Reload the systemd configuration.
CONSOLEEnable and start the exporter.
CONSOLEVerify that the exporter serves Lustre metrics on port
9169.CONSOLEThe output lists Lustre-specific metrics for capacity, LNET statistics, and component health.
Deploy Prometheus
Prometheus scrapes the metrics from the Lustre exporter and stores them as time-series data. Run the following steps on the MDS.
Download the Prometheus archive.
CONSOLEExtract the archive.
CONSOLEMove the extracted directory to a system location.
CONSOLEOpen the Prometheus configuration file.
CONSOLEReplace the contents with the following configuration.
YAMLSave and close the file.
Create the systemd unit file for Prometheus.
CONSOLEAdd the following content.
INISave and close the file.
Apply the SELinux context that permits systemd to execute the binary.
CONSOLEReload the systemd configuration.
CONSOLEEnable and start Prometheus.
CONSOLEVerify that Prometheus scrapes the Lustre exporter successfully.
CONSOLEThe output reports
"health":"up"for the Lustre target.
Install Grafana
Grafana provides interactive dashboards for the Lustre metrics that Prometheus stores. Run the following steps on the MDS.
Open the Grafana repository configuration.
CONSOLEAdd the following content.
INISave and close the file.
Install Grafana.
CONSOLEEnable and start Grafana so it initializes the internal database with the correct ownership.
CONSOLEReset the admin password. Replace
ADMIN-PASSWORDwith a strong password.CONSOLEAllow incoming traffic on port
3000through the firewall.CONSOLEReload the firewall to apply the rule.
CONSOLEOpen
http://MDS-IP-ADDRESS:3000in a web browser, replacingMDS-IP-ADDRESSwith the public IP of your MDS node, then log in asadminwith the password you set.Click Connections, select Data sources, click Add data source, and choose Prometheus.
Set the connection URL to
http://localhost:9090, then click Save & test. Grafana confirms successful connectivity to the Prometheus API.Click Dashboards, select New, then New dashboard, and click Add visualization.
Choose Prometheus as the data source, switch the query editor to Code mode, and enter the following query:
lustre_capacity_kibibytes.Click Run queries to display MDT and MGS capacity over time, then click Save to persist the dashboard.
Configure High Availability
Pacemaker and Corosync provide active-passive failover for the MDS. The cluster monitors node health and migrates the MDT mount to a standby node when the active node fails. This section requires a second MDS node with the Lustre server packages installed, and a block device that both MDS nodes can access.
Important
Shared-storage failover requires a block device that both MDS nodes attach simultaneously through a SAN, iSCSI target, or a cloud multi-attach feature. Vultr Block Storage attaches to one instance at a time, so the shared MDT resource in this section is illustrative on Vultr. The cluster stack itself deploys and forms a quorum as shown, which you can pair with shared storage on infrastructure that provides it.
Install Cluster Packages
Run the following steps on both MDS nodes. The cluster software resides in the Enterprise Linux high availability repository.
Enable the high availability repository.
CONSOLEInstall Pacemaker, Corosync, pcs, and the fence agents.
CONSOLEOpen the cluster service ports through the firewall.
CONSOLEReload the firewall.
CONSOLEEnable and start the pcs daemon.
CONSOLESet the password for the
haclusteruser. ReplaceCLUSTER-PASSWORDwith a strong password.CONSOLE
Important
Corosync requires each node's hostname to resolve to a single IPv4 address that is identical on both nodes and points to the cluster network, not a loopback address. Cloud images that use cloud-init map the hostname to both 127.0.0.1 and ::1 in /etc/hosts, which causes Corosync to fail with a "different IP families" error. On both nodes, set manage_etc_hosts: false in /etc/cloud/cloud.cfg, remove the loopback entries for the node hostnames from /etc/hosts, and add one IPv4 entry per node that maps each hostname to its VPC address (for example, 10.42.0.4 lustre-mds and 10.42.0.7 lustre-mds2).
Form the Cluster
Run the following steps from the primary MDS, which coordinates the configuration on both nodes.
Authenticate both nodes against pcsd. Replace the hostnames with your MDS hostnames and
CLUSTER-PASSWORDwith the password you set.CONSOLECreate the cluster.
CONSOLEStart the cluster on all nodes.
CONSOLEEnable the cluster to start automatically on boot.
CONSOLEVerify the cluster status.
CONSOLEThe output reports both nodes as
Onlineand the partition as having quorum.
Define the MDT Resource
Run the following step on the primary MDS. The cluster manages the MDT mount as a Pacemaker resource that fails over to the standby node when the active node becomes unavailable.
Define the file system resource on the shared block device. Replace
SHARED-DEVICEwith the path to your shared block device.CONSOLE
Note
Production deployments require fencing devices (STONITH) that match the underlying infrastructure. Configure STONITH agents specific to your platform before placing the cluster into production. The default stonith-enabled=false setting suits initial verification only.
Verify the Deployment
Benchmarks confirm that the deployment delivers the expected throughput. IOR measures parallel I/O throughput, and mdtest measures metadata operation throughput. Both tools run from the client node.
Build IOR and mdtest
IOR ships its source code on GitHub, which the Lustre client compiles from source. The mdtest binary builds alongside IOR.
Install the build dependencies.
CONSOLELoad the OpenMPI environment module.
CONSOLELoad the OpenMPI module.
CONSOLEClone the IOR repository.
CONSOLEEnter the IOR directory.
CONSOLECheck out the 4.0.0 release tag for a reproducible build.
CONSOLEGenerate the build configuration.
CONSOLERun the configure script.
CONSOLECompile IOR and mdtest.
CONSOLE
Run the Benchmarks
The benchmarks read and write inside dedicated directories on the Lustre file system.
Create a benchmark directory.
CONSOLESet permissions so the benchmark can write to the directory.
CONSOLENavigate to the IOR source directory.
CONSOLERun IOR with a 100 MiB block size and a 1 MiB transfer size.
CONSOLE-w -r: Performs both write and read tests.-t 1M: Sets the transfer size to 1 MiB.-b 100M: Sets the block size per process to 100 MiB.-F: Uses file-per-process mode.
The output reports the maximum write and read throughput in MiB/s.
Create the mdtest directory.
CONSOLESet permissions so mdtest can write to the directory.
CONSOLERun mdtest with 100 files per iteration and 2 iterations.
CONSOLEThe output reports rates for directory creation, file creation, file stat, and file removal.
Note
The benchmarks may print PSM3 warnings such as Failed to get eth0 (unit 0) cpu set on cloud Ethernet networks. The warnings are harmless and indicate that OpenMPI fell back from InfiniBand-style transport to standard Ethernet. The benchmark results remain valid.
Migrate from AWS FSx for Lustre to Self-Hosted Lustre
This section outlines the strategy for migrating workloads from AWS FSx for Lustre to a self-hosted Lustre deployment. It focuses on the concepts and the tools involved so the approach stays applicable as environments and tooling versions change. Refer to the current AWS FSx for Lustre and Lustre manual for exact commands and options when you plan your migration.
Data Migration
Data migration moves the existing data set from AWS FSx to self-hosted Lustre through an intermediate S3 bucket, using stable, general-purpose interfaces rather than version-specific tooling. AWS FSx for Lustre links to an S3 bucket through a Data Repository Association, so the source side exports the file system contents to that bucket with an FSx data repository export task (aws fsx create-data-repository-task --type EXPORT_TO_REPOSITORY). On the destination side, a client that has the self-hosted Lustre file system mounted pulls the data down from the bucket with the AWS CLI (aws s3 sync) and writes it into a directory on the Lustre mount.
Because aws s3 sync accepts an --endpoint-url, the same approach works against any S3-compatible endpoint, which keeps the migration portable across AWS S3, Vultr Object Storage, and on-premises object stores. For large data sets, parallelize the transfer by running the sync from multiple clients against different prefixes, or copy directly between two mounted file systems with lfs migrate and rsync.
Client Migration
Client migration redirects each compute client from the FSx DNS endpoint to the self-hosted MDS address. Because Lustre presents the same POSIX interface on both sides, applications continue to work without code changes. On each client, unmount the FSx file system and mount the self-hosted file system in its place with mount -t lustre MDS-IP-ADDRESS@tcp:/lustrefs, using the MDS address on the Lustre network and your file system name. After remounting, applications read and write through the same paths they used with FSx.
S3 Integration Migration
Lustre Hierarchical Storage Management (HSM) is the self-hosted equivalent of the FSx S3 Data Repository. It tiers data automatically between Lustre and an S3-compatible object storage backend such as Vultr Object Storage. The HSM coordinator runs on the MDS (enabled through the mdt.*.hsm_control parameter), a copytool such as lhsmtool_posix runs on a client, and the backend is any POSIX directory that an S3 bucket exposes through a FUSE mount like s3fs. With HSM active, lfs hsm_archive copies a file to the S3 backend, lfs hsm_release frees the local copy while keeping the file in the namespace, and the next read transparently restores the content from S3. A policy engine such as Robinhood automates archive and release decisions based on age, size, or capacity thresholds.
Note
With an s3fs backend, the copytool logs fsetxattr ... Operation not supported messages during archive because s3fs does not implement extended attributes. The archive and restore operations still succeed, and the file's stripe layout is stored in a companion object alongside the data.
Data Storage Considerations
FSx for Lustre manages capacity expansion automatically, while a self-hosted deployment requires manual OST expansion. Plan capacity for the MDT and the OSTs based on expected workload patterns.
- MDT sizing: Each file consumes approximately 2 KiB of MDT space, so plan for at least 1 GiB of MDT capacity per million files.
- OST sizing: Calculate the aggregate capacity across all OSTs, then add 20 percent overhead for file system metadata and a growth buffer.
- Adding capacity: Format new OST volumes with the next sequential index and mount them on a new or existing OSS node. The MGS recognizes new OSTs automatically, and the MDS distributes new file stripes across the expanded set.
Things to Consider during Migration
The following items require attention during the migration window:
- Auto-scaling differences: FSx scales storage transparently, while self-hosted Lustre requires manual OST addition. Provision sufficient initial OST capacity to cover projected growth.
- S3 sync direction: FSx supports bidirectional automatic sync between the file system and S3. Self-hosted HSM uses explicit archive and restore operations, so writes to Lustre do not propagate to S3 automatically without a policy engine such as Robinhood.
- Kernel module compatibility: Lustre client kernel modules must match the kernel version on each client. Update client packages whenever the client kernel changes, and pin the kernel on server nodes.
- LNET configuration: The default TCP transport works for most cloud environments. InfiniBand deployments require additional LNET configuration on every node, with a matching transport on both servers and clients.
- Metrics migration: FSx integrates with CloudWatch for metrics and alarming. The self-hosted equivalent uses the Lustre Prometheus exporter and Grafana dashboards, which require additional setup but provide deeper customization.
- Backup strategy: FSx provides automated snapshots, while self-hosted Lustre requires explicit backup procedures. Combine
lfs findwithtarorrsyncto back up file data, and use MDT snapshots through LDISKFS or LVM at the storage layer for the metadata. - Cost model: FSx applies per-TiB pricing that scales with capacity, while self-hosted Lustre cost depends on the underlying compute and storage. Calculate the breakeven capacity that justifies the operational overhead of self-management.
Conclusion
You have deployed a Lustre file system cluster as an alternative to AWS FSx for Lustre, with a Metadata Server, two Object Storage Servers, and a client, then configured striping and Progressive File Layouts, LNET networking, quotas and POSIX ACLs, Prometheus and Grafana monitoring, Pacemaker high availability, and HSM-based S3 integration. The cluster delivers parallel I/O throughput across multiple OSTs and supports the full Lustre POSIX interface that applications expect from FSx. For advanced tuning options such as Distributed Namespace (DNE), network striping, and the Robinhood policy engine, see the official Lustre documentation.


0 Comments
Be the first to comment and share your perspective with the community.