How to Ensure Cluster Reliability with ChaosMesh on Kubernetes

Introduction
Chaos engineering is a fault detection practice that involves intentionally injecting faults to test system reliability and resilience to identify potential failures before they result in outages. Chaos Engineering offers engineers a better understanding of how the system reacts to stress and can more efficiently reduce or eliminate failure.
Chaos Engineering benefits system reliability in many ways which include:
- Weakness Identification: Chaos Engineering helps to identify weaknesses in a distributed system environment by intentionally inducing failures. This helps engineers to understand how the system behaves under stress and how to effectively recover from failures.
- Downtime Reduction: Chaos Engineering identifies and addresses potential failure points that lead to the reduction of downtime occurrences and enhance system resilience to withstand unexpected conditions.
- Improved Resilience: By conducting chaos experiments, engineers gain insights into system strengths and weaknesses to make informed decisions that improve resilience.
Chaos Mesh is an open-source chaos engineering platform that performs fault simulation and injection tasks in Kubernetes environments. Chaos Mesh supports multiple scenarios such as network latency, packet loss, pod deletion, CPU, and memory resource exhaustion to simulate real-world failure scenarios and evaluate a cluster's resilience in different circumstances.
This article explains how to install Chaos Mesh on Kubernetes using the Vultr Kubernetes Engine (VKE). You will run NetworkChaos experiments to inject transient failures into HTTP Kubernetes services using Kubectl and the Chaos Mesh dashboard.
Prerequisites
Before you begin:
Deploy a Vultr Kubernetes Engine (VKE) cluster with at least three nodes.
Deploy a Ubuntu server to use as the management workstation.
Access the server using SSH as a non-root user with sudo privileges.
Install the Helm package manager:
console$ snap install helm --classic
This article uses the example domainsNotedashboard.example.com,first.example.com,second.example.com. Replace each domain record with your actual subdomain that points to the Nginx Ingress Controller Load Balancer IP address.
Deploy Sample HTTP Services
To test the Chaos Mesh detection functionalities, follow the steps below to deploy two sample HTTP services http-server-first and http-server-second to inject with network failures within your cluster.
Create a new Deployment YAML file
http-server-firstto specify the first HTTP service pod template.console$ nano http-server-first.yaml
Add the following configurations to the file.
yamlapiVersion: apps/v1 kind: Deployment metadata: name: http-server-first spec: replicas: 3 selector: matchLabels: app: http-server-first template: metadata: labels: app: http-server-first spec: containers: - name: http-server-first image: httpd:latest ports: - containerPort: 80 env: - name: MESSAGE value: "Welcome to the first http server!"
Save and close the file.
The above deployment file creates a new HTTP service using the Apache
httpd:latestimage with the default outputWelcome to the first http server!.Apply the deployment to your Kubernetes cluster.
console$ kubectl apply -f http-server-first.yaml
Create a new Deployment file to define the second HTTP service
http-server-secondpod template.console$ nano http-server-second.yaml
Add the following configurations to the file.
yamlapiVersion: apps/v1 kind: Deployment metadata: name: http-server-second spec: replicas: 3 selector: matchLabels: app: http-server-second template: metadata: labels: app: http-server-second spec: containers: - name: http-server-second image: httpd:latest ports: - containerPort: 80 env: - name: MESSAGE value: "Welcome to our second http server!"
Save and close the file.
Apply the deployment to your cluster.
console$ kubectl apply -f http-server-second.yaml
View the cluster deployments and verify that the new resources are ready and available.
console$ kubectl get deployment
Output:
NAME                                     READY   UP-TO-DATE   AVAILABLE   AGE
http-server-first                        3/3     3            3           9m21s
http-server-second                       3/3     3            3           9m16s
Create a new Service YAML file to define how the sample deployments communicate within the cluster.
console$ nano service.yaml
Add the following configurations to the file.
yamlapiVersion: v1 kind: Service metadata: name: http-server-first spec: selector: app: http-server-first ports: - protocol: TCP port: 80 targetPort: 80 --- apiVersion: v1 kind: Service metadata: name: http-server-second spec: selector: app: http-server-second ports: - protocol: TCP port: 80 targetPort: 80
Save and close the file.
The above configuration creates a new Service resource for each of the HTTP applications running on the Internal port
80.Apply the resource to your cluster.
console$ kubectl apply -f service.yaml
Expose the HTTP Services for External Access
To access the sample HTTP services outside the cluster, follow the steps below to install the Nginx Ingress Controller and enable an external Vultr Load Balancer IP address to use with the domains associated with the cluster services.
Add the Nginx Ingress repository to your Helm sources.
console$ helm repo add ingress-nginx https://kubernetes.github.io/ingress-nginx
Update the Helm repositories.
console$ helm repo update
Install the Nginx Ingress Controller to your cluster using Helm.
console$ helm install nginx-ingress ingress-nginx/ingress-nginx --set controller.publishService.enabled=true
Wait for at least
5minutes for the Nginx Ingress Controller deployment process to complete. Then, view the cluster services to verify the external Load Balancer IP address assigned to the Nginx Ingress Controller service.console$ kubectl get service --namespace default nginx-ingress-ingress-nginx-controller
Your output should look like the one below:
NAME                                     TYPE           CLUSTER-IP     EXTERNAL-IP     PORT(S)                      AGE
nginx-ingress-ingress-nginx-controller   LoadBalancer   10.98.94.144   192.0.2.102   80:32671/TCP,443:32325/TCP   2m58s
Keep note of the external IP address value, for example,
192.0.2.102to use with your domain records. For additional monitoring, verify that the assigned IP address matches your Vultr Load Balancer IP attached to the VKE cluster.Access your domain DNS configuration page and point your subdomain A records to the load balancer IP address. Replace
192.0.2.102with your actual public IP address.first.example.com:192.0.2.102second.example.com:192.0.2.102dashboard.example.com:192.0.2.102
Create a new Ingress resource file
ingress.yamlto expose the HTTP services.console$ nano ingress.yaml
Add the following configurations to the file. Replace
first.example.comandsecond.example.comwith your actual domains.yamlapiVersion: networking.k8s.io/v1 kind: Ingress metadata: name: kubernetes-ingress annotations: kubernetes.io/ingress.class: nginx spec: rules: - host: "first.example.com" http: paths: - pathType: Prefix path: "/" backend: service: name: http-server-first port: number: 80 - host: "second.example.com" http: paths: - pathType: Prefix path: "/" backend: service: name: http-server-second port: number: 80
The above Ingress configuration forwards all root requests from
first.example.comandsecond.example.comto your HTTP services on port80.Apply the Ingress resource to your cluster.
console$ kubectl apply -f ingress.yaml
View the cluster Ingress objects and verify that the new resource is available.
console$ kubectl get ingress
Output:
NAME                 CLASS    HOSTS                                    ADDRESS         PORTS   AGE
kubernetes-ingress   <none>   first.example.com,second.example.com                      80      3m
To test the HTTP services, visit your first domain using a web browser such as Firefox or Chrome
http://first.example.com
Visit the second service domain in a new browser window to verify access to the HTTP service.
http://second.example.com
Install Chaos Mesh to the Kubernetes Cluster
Add the Chaos Mesh Helm repository to your sources.
console$ helm repo add chaos-mesh https://charts.chaos-mesh.org
Update the Helm repository index.
console$ helm repo update
Create a new Chaos Mesh namespace
chaos-meshin your cluster.console$ kubectl create ns chaos-mesh
Create a new
values.yamlfile to customize the Chaos Mesh configuration by overriding the default values.console$ nano values.yaml
Add the following configurations to the file.
yamlchaosDaemon: runtime: containerd socketPath: /run/containerd/containerd.sock
The above configuration overrides the default Chaos Mesh cluster details with the following values:
chaosDaemon: Defines the Chaos Mesh service name.runtime: containerd: Specifies thechaosDaemonruntime environment.socketPath: /run/containerd/containerd.sock: Specifies the Unix socket path used by thechaosDaemoncomponent for communications with the container runtime.
Deploy Chaos Mesh to the cluster using the custom
values.yamlconfigurations.console$ helm install chaos-mesh chaos-mesh/chaos-mesh -n=chaos-mesh -f values.yaml
View all Pods in the Chaos Mesh namespace and verify that all resources are running.
console$ kubectl get pods --namespace chaos-mesh -l app.kubernetes.io/instance=chaos-mesh
Output:
NAME                                       READY   STATUS    RESTARTS   AGE
chaos-controller-manager-9d9895f4f-fd92d   1/1     Running   0          77s
chaos-controller-manager-9d9895f4f-hpz8p   1/1     Running   0          77s
chaos-controller-manager-9d9895f4f-wvq7m   1/1     Running   0          77s
chaos-daemon-7ng72                         1/1     Running   0          78s
chaos-daemon-nvklg                         1/1     Running   0          78s
chaos-daemon-vjj6z                         1/1     Running   0          78s
chaos-dashboard-54c7d9d-8zh4j              1/1     Running   0          77s
chaos-dns-server-66d757d748-h9mxp          1/1     Running   0          77s
Run a Chaos Experiment
To test the resilience of your Kubernetes applications, perform different types of chaos experiments using Chaos Mesh such as NetworkChaos, DNSChaos, KernelChaos, and PodChaos. Follow the steps below to create an experiment using NetworkChaos that injects network failures into existing HTTP services within the cluster.
Create a new experiment YAML file
network-corruption.yamlto define the NetworkChaos configuration.console$ nano network-corruption.yaml
Add the following configurations to the file.
yamlkind: NetworkChaos apiVersion: chaos-mesh.org/v1alpha1 metadata: namespace: default name: network-corruption spec: selector: namespaces: - default labelSelectors: app: http-server-first mode: all action: corrupt corrupt: corrupt: '100' direction: to
Save and close the file.
The above configuration sets up a NetworkChaos experiment in the
defaultcluster namespace that targets thehttp-server-firstapplication pods and injects100%corruption into the pod's network activity.Apply the experiment to your cluster.
console$ kubectl apply -f network-corruption.yaml
Wait for at least
3minutes and access the target HTTP application domain in your web browser.http://first.example.comVerify that the application returns a
504 Gateway- Time-outerror because of the active NetworkChaos experiment with a high corruption percentage (100%).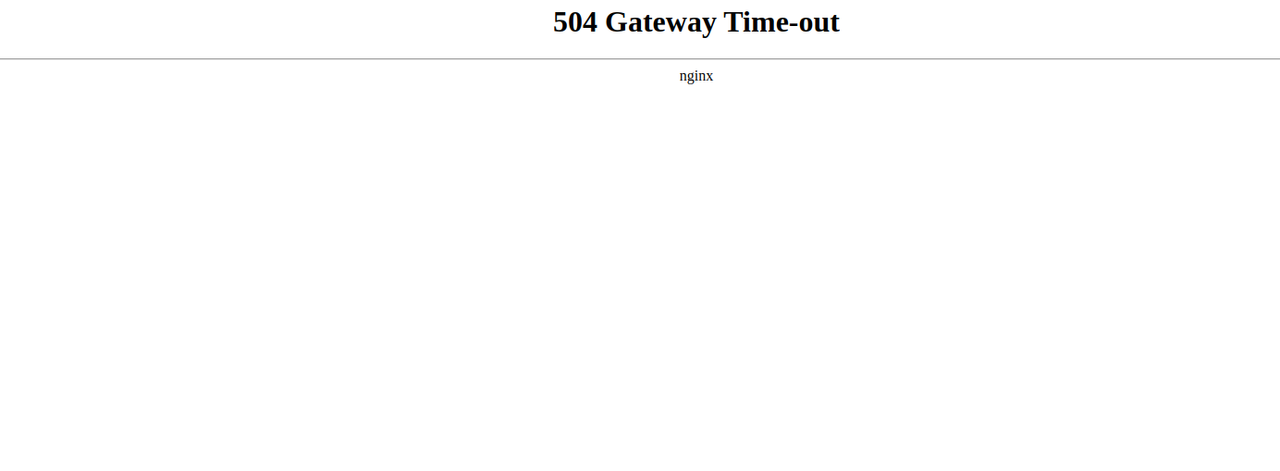
Run the following command to edit the NetworkChaos values and pause the experiment.
console$ kubectl annotate networkchaos network-corruption experiment.chaos-mesh.org/pause=true --overwrite
Navigate to your browser again, refresh the page and verify that you can correctly access the first HTTP service.
Schedule Chaos Experiments
Chaos Mesh supports scheduled experiences to continuously validate the cluster reliability. Follow the steps below to create and schedule a NetworkChaos experiment to automate network corruption to the first HTTP service in your cluster.
Create a new resource file
network-corruption-schedule.yamlto define an experiment schedule.console$ nano network-corruption-schedule.yaml
Add the following configurations to the file.
yamlapiVersion: chaos-mesh.org/v1alpha1 kind: Schedule metadata: name: network-corruption-schedule spec: schedule: '* * * * *' historyLimit: 2 type: 'NetworkChaos' networkChaos: action: corrupt mode: all selector: namespaces: - default labelSelectors: app: http-server-first corrupt: corrupt: '100' correlation: '0' direction: to duration: '10s'
Save and close the file.
The above experiments add corruption to the first HTTP service network traffic for
10seconds depending on the execution schedule. Within the configuration:schedule: '* * * * *': Specifies the schedule to run every minute using the Cron syntax.historyLimit: Sets the maximum number of completed schedules to keep within the cluster. The value2keeps two completed schedules.action: Specifies the action to perform on the target application's network traffic.labelSelectors: Defines the target application to apply the chaos experiment.corrupt: Specifies the traffic percentage to corrupt with the experiment. The value100corrupts all network packets.duration: Specifies how long the chaos experiment runs. The value,10ssets the corruption duration to 10 seconds.
Apply the configuration to your cluster.
console$ kubectl apply -f network-corruption-schedule.yaml
View all available NetworkChaos objects in the cluster.
console$ kubectl get networkchaos -w
Verify that a new chaos experiment runs every 10 seconds similar to the output below.
NAME                 ACTION    DURATION
network-corruption   corrupt
network-corruption-schedule-k576x   corrupt   10s
network-corruption-schedule-k576x   corrupt   10s
network-corruption-schedule-k576x   corrupt   10s
network-corruption-schedule-k576x   corrupt   10s
network-corruption-schedule-k576x   corrupt   10s
network-corruption-schedule-k576x   corrupt   10s
network-corruption-schedule-k576x   corrupt   10s
Access the HTTP service in your web browser to verify the experiment processes.
http://first.example.comVerify that a
504 Gateway Time-outerror displays in your browser session every first 10 seconds of a minute.
Access the Chaos Mesh Dashboard
Chaos Mesh runs with a graphical web dashboard you can use to create and manage chaos experiments, monitor their progress, and analyze the results using a graphical interface. Follow the steps below to enable the Chaos Mesh dashboard in your cluster, set up an Ingress resource to expose the application and access it using your domain.
Open the
values.yamlfile.console$ nano values.yaml
Add the following configurations at the end of the file. Replace
dashboard.example.comwith your actual domain.yamldashboard: ingress: enabled: true ingressClassName: nginx hosts: - name: dashboard.example.com
The above configuration enables the Chaos Mesh dashboard using the Nginx Ingress controller with the domain
dashboard.example.comfor external access.Apply the modified
values.yamlto your cluster.console$ helm upgrade chaos-mesh chaos-mesh/chaos-mesh -n=chaos-mesh -f values.yaml
View all pods in the
chaos-meshnamespace and verify that the new dashboard resources are ready.console$ kubectl get pods --namespace chaos-mesh -l app.kubernetes.io/instance=chaos-mesh
Output:
NAME                                        READY   STATUS    RESTARTS   AGE
chaos-controller-manager-85498c8b4c-kbdcw   1/1     Running   0          88s
chaos-controller-manager-85498c8b4c-rl8s2   1/1     Running   0          84s
chaos-controller-manager-85498c8b4c-sh9q9   1/1     Running   0          93s
chaos-daemon-cnvb4                          1/1     Running   0          94s
chaos-daemon-jnhkg                          1/1     Running   0          84s
chaos-daemon-pdgv7                          1/1     Running   0          90s
chaos-dashboard-54c7d9d-4zml4               1/1     Running   0          94s
chaos-dns-server-66d757d748-h9mxp           1/1     Running   0          55m
The Chaos Mesh dashboard requires an access token for authentication purposes. Create a new RBAC configuration file
dashboard-rbac.yamlto define cluster management resources.console$ nano dashboard-rbac.yaml
Add the following configurations to the file.
yamlkind: ServiceAccount apiVersion: v1 metadata: namespace: default name: account-cluster-manager-dashboard --- kind: ClusterRole apiVersion: rbac.authorization.k8s.io/v1 metadata: name: role-cluster-manager-dashboard rules: - apiGroups: [""] resources: ["pods", "namespaces"] verbs: ["get", "watch", "list"] - apiGroups: ["chaos-mesh.org"] resources: [ "*" ] verbs: ["get", "list", "watch", "create", "delete", "patch", "update"] --- apiVersion: rbac.authorization.k8s.io/v1 kind: ClusterRoleBinding metadata: name: bind-cluster-manager-dashboard subjects: - kind: ServiceAccount name: account-cluster-manager-dashboard namespace: default roleRef: kind: ClusterRole name: role-cluster-manager-dashboard apiGroup: rbac.authorization.k8s.io
Save and close the file.
Within the configuration:
ServiceAccount: Authenticates and enables access to resources within the Kubernetes cluster.ClusterRole: Defines a new ClusterRolerole-cluster-manager-dashboardthat specifies the Kubernetes and Chaos Mesh resource access permissions.ClusterRoleBinding: Binds theServiceAccountto theClusterRoleand grants all defined permissions.
Apply the configuration to your cluster.
console$ kubectl apply -f dashboard-rbac.yaml
Create a new access using the
account-cluster-manager-dashboardresource.console$ kubectl create token account-cluster-manager-dashboard
Verify and copy the generated access token to your clipboard similar to the output below:
eyJhbGciOiJSUzI1NiIsImtpZCI6IkNIaUZfU3RUc3lxanpvTVF2b0x3aWZZU2pibzg3dHVrSGtodEtROGRDa0kifQ.eyJhdWQiOlsiaHR0cHM6Ly9rdWJlcm51bHQuc3ZjIiwic3lzdGVtOmtvbm5lY3Rpdml0eS1zZXJ2ZXIiXSwiZXhwIjoxNzEwMzk0NjcwLCJpYXQiOjE3MTAzOTEwNzAsImlzcyI6Imh0dHBzOi8va3ViZXJuZXRlcy5kZWZhdWx0LnN2YyIsImt1YmVybmV0ZXMuaW8iOnsibmFtZXNwYWNlIjoiZGVmYXVsdCIsInNlcnZpY2VhY2NvdW50Ijp7Im5hbWUiOiJhY2NvdW50LWNsdXN0ZXItbWFuYWdlci1kYXNoYm9hcmQiLCJ1aWQiOiI1NzM4ZjMyZC0wZGY1LTQ3MTEtYjBmNy05NDk4NTMzMTI0NWYifX0sIm5iZiI6MTcxMDM5MTA3MCwic3ViIjoic3lzdGVtOnNlcnZpY2VhY2NvdW50OmRlZmF1bHQ6YWNjb3VudC1jbHVzdGVyLW1hbmFnZXItZGFzaGJvYXJkIn0.afhENuTfKenZp_OfzlN4MtnPiBBEKYgU1wvozZcAnRnA1Dv5x_VqVWHYprDHnvTQEWGD_XDJwA9YE_VIV5IVUEMIYX2JD_ts3R-6IDm8hv4NsIO8XBzsQrtKO6SO6uDAkNvmZtIDTjpxWMijPCbzA6fYWk8-ZAiIg5AdJzhXKQZOoTp9S5w5lxmXY3-eBtklciup05zkGnG5jdjSJOPfT0sfBCQKFvZp8j7133aqF6cpSIzaunUrwSHSNl3VowWRfbgXg6_keGzMbkJyxgZHc2Y9xGMrmxfmMFaxTuraw7Z7OJIBrg5CN9TUJktlHP8teHZ_ZQ1ka6IfXAAZpBSiSgAccess the Chaos Mesh dashboard domain in a new web browser window to use the web interface.
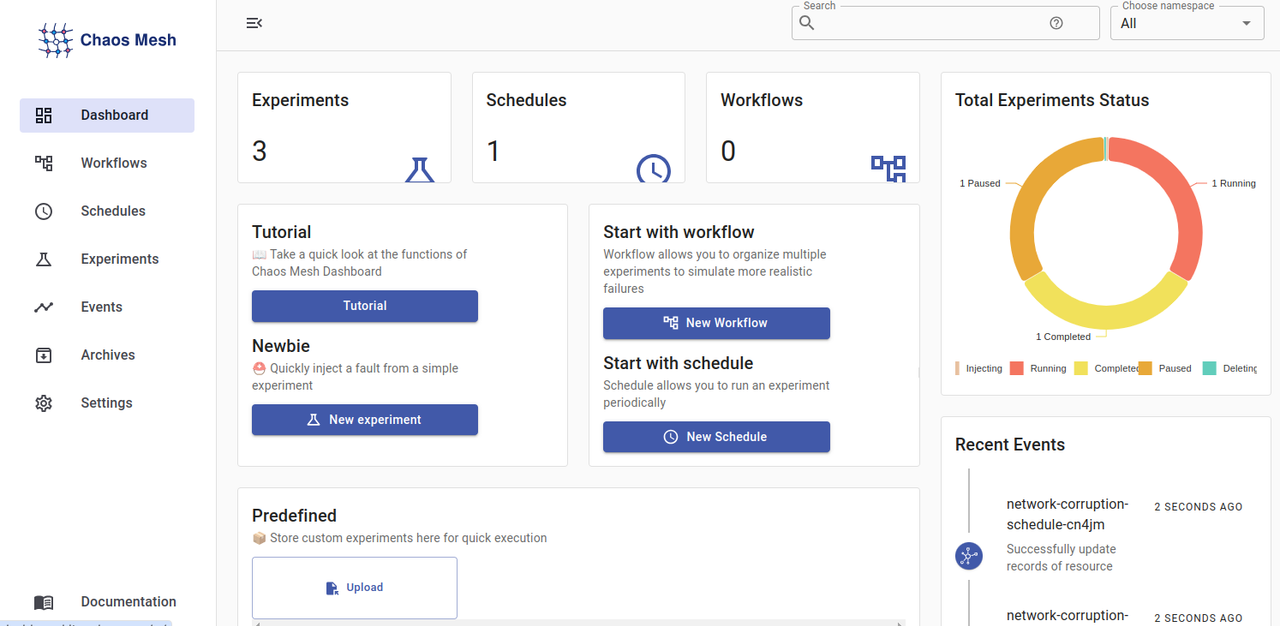
http://dashboard.example.comPaste your generated access token in the Token field, and enter your desired token name in the Name field.
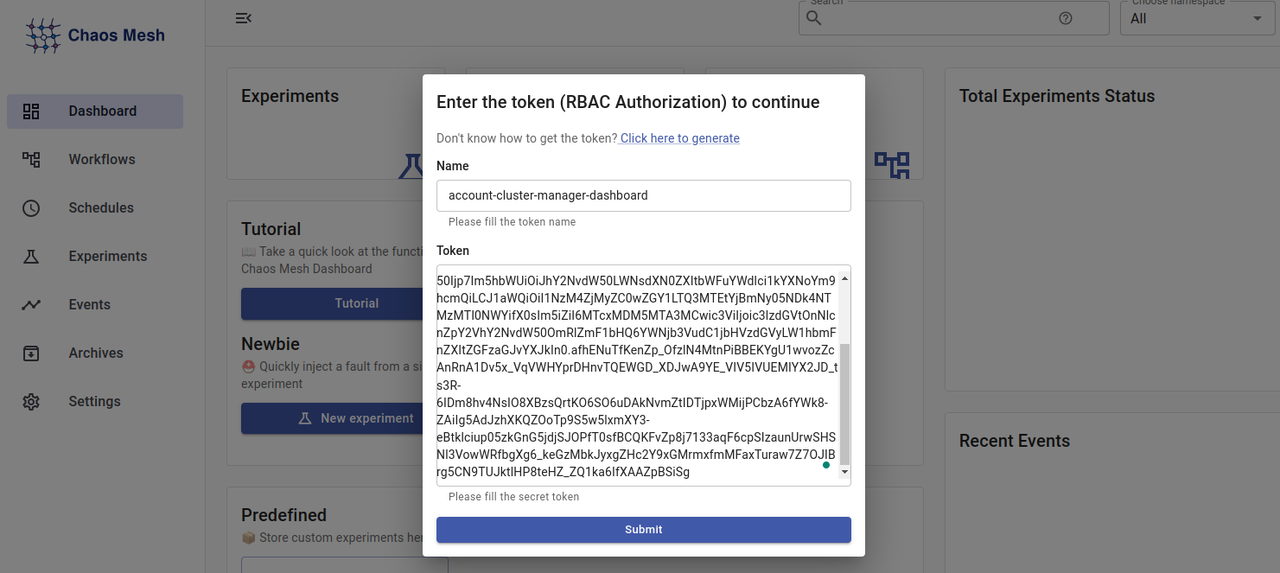
Click Submit to log in and access the Chaos Mesh dashboard.
Run a Chaos Experiment using the Chaos Mesh Dashboard
Follow the steps below to create, run and monitor a chaos experiment using the graphical interface in a process similar to the cluster CLI procedure.
Click Schedules on the left navigation menu to view all Scheduled experiments within the cluster.
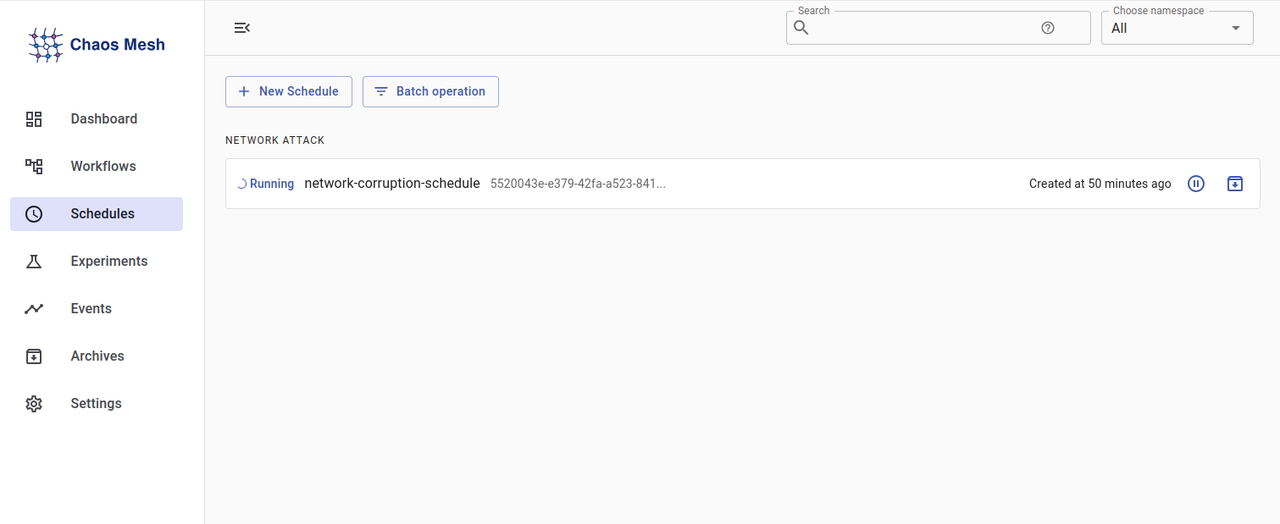
Click the Pause button and select Confirm to pause the scheduled experiment.
Click Experiments on the left navigation bar to view all deployed experiments.
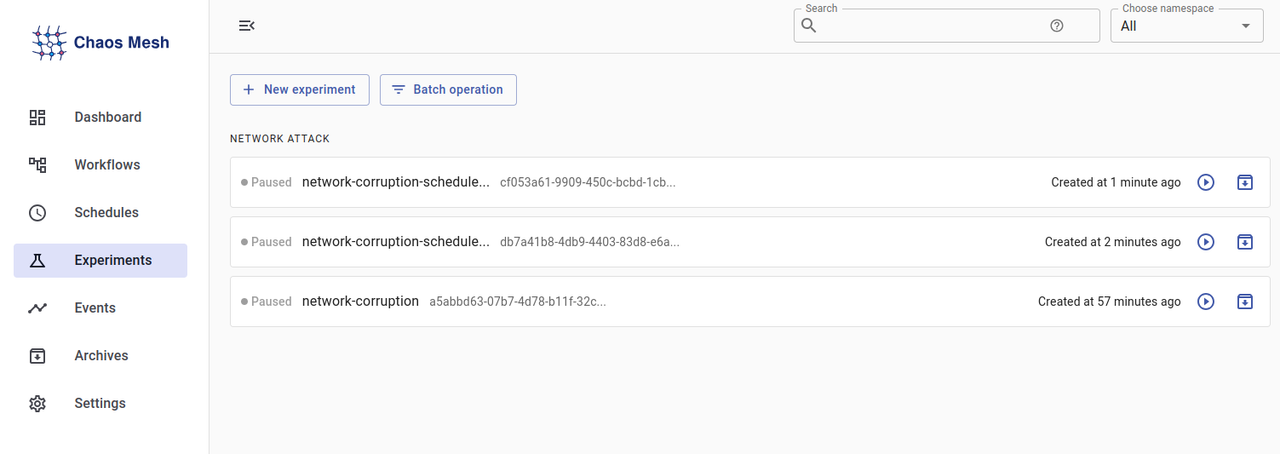
Verify that all experiments appear in a paused state based on your earlier schedule.
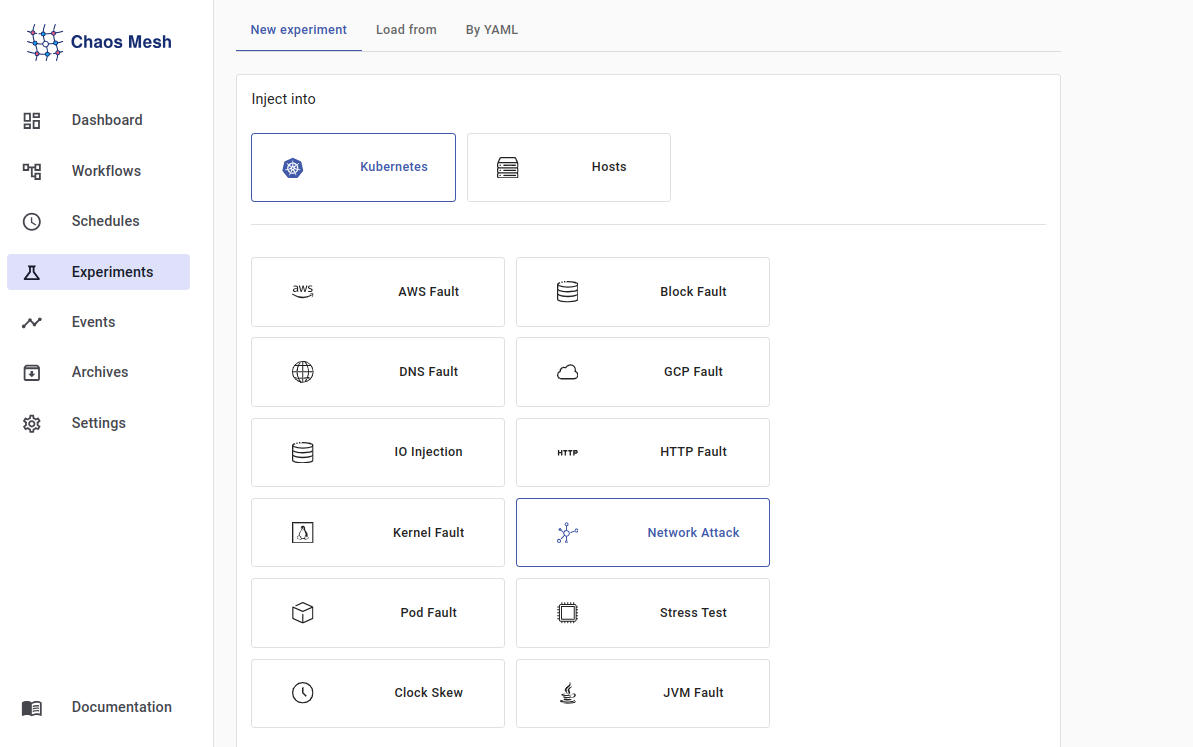
Click New experiment to create a new experiment and keep Kubernetes as the inject platform. Then, select Network Attack to set the experiment type.
Click Corrupt as the experiment action, enter
100as the corruption percentage and click Submit to enable the experiment information properties.
Click the Namespace Selectors field and select
defaultto use the default cluster namespace. Enter your desired experiment name in the Metadata field, select thehttp-server-secondHTTP service in the Label Selectors field and toggle to activate the Run continuously option. Then, click Submit to save the experiment information.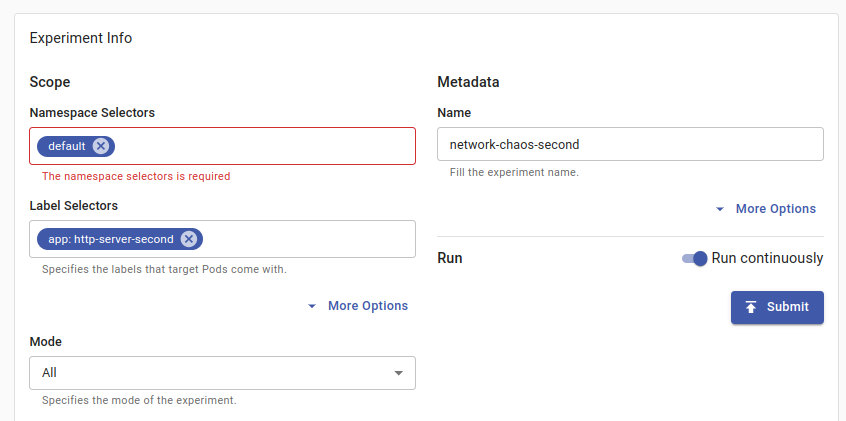
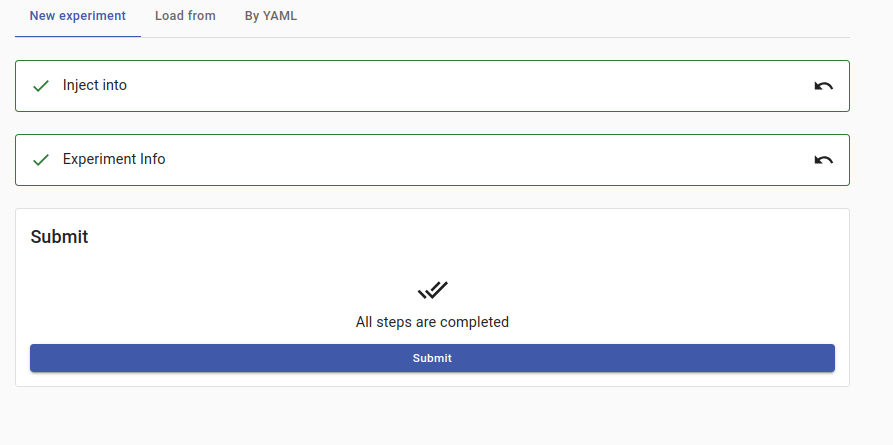
Click Submit in the New experiment summary to apply the Chaos experiment.
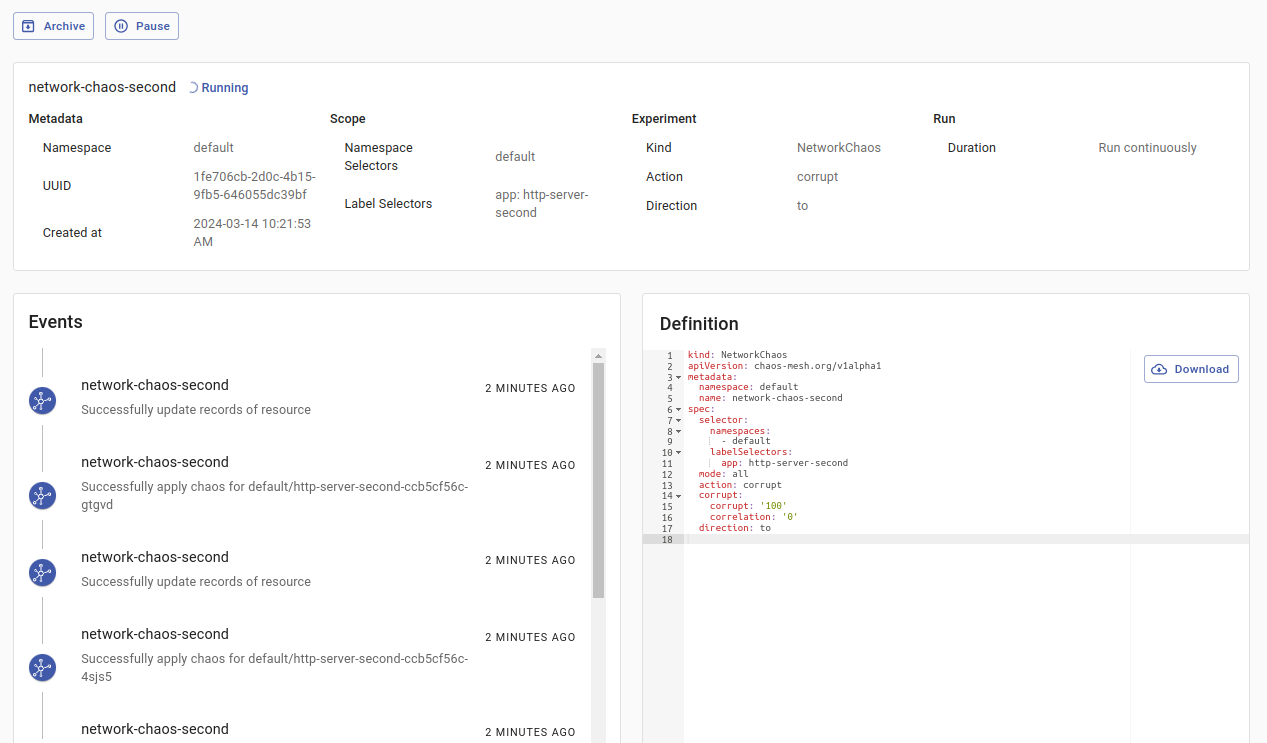
Click the new running experiment on your Experiments page to view more information about the associated cluster events.
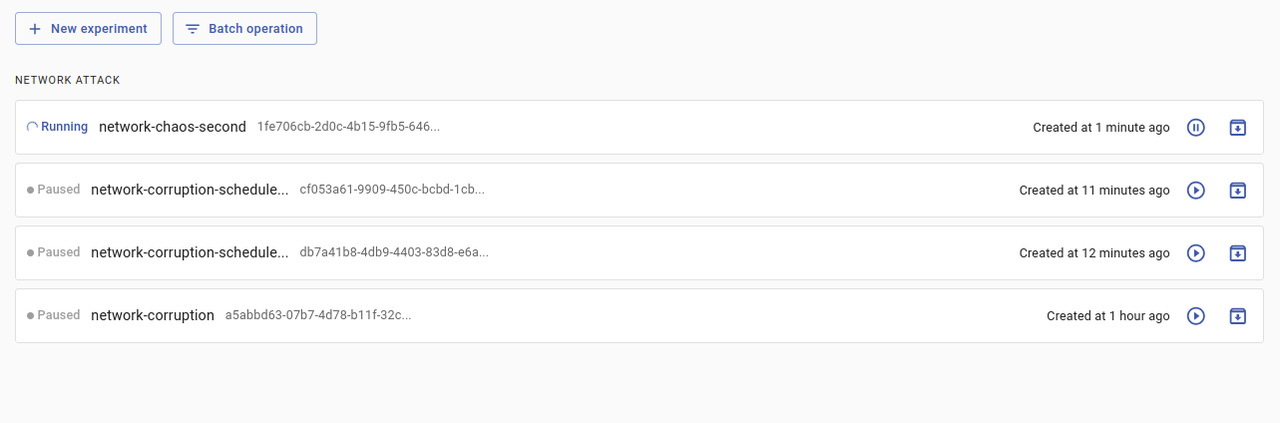
Click the running experiment to see more information about your experiment.
Access your target HTTP service domain in a browser window and verify that a
504 Gateway Time-outerror displays in your session.http://second.example.com
Run Chaos Workflows Using Kubectl
Chaos workflows allow you to deploy a set of chaos experiments at once to intentionally disrupt a system in a controlled way. In addition, you can track the workflow's progress, monitor individual experiment outcomes, and analyze the chaos impact on your system. Follow the steps below to run Chaos workflows using a NetworkChaos experiment with a 9000ms delay and StatusCheck to continuously monitor the second HTTP service availability within the cluster.
Create a new chaos workflow configuration file.
console$ nano networkchaos-statuscheck-workflow.yaml
Add the following configurations to the file.
yamlapiVersion: chaos-mesh.org/v1alpha1 kind: Workflow metadata: name: networkchaos-statuscheck-workflow spec: entry: the-entry templates: - name: the-entry templateType: Parallel deadline: 180s children: - workflow-status-check - workflow-network-chaos - name: workflow-status-check templateType: StatusCheck deadline: 180s abortWithStatusCheck: true statusCheck: mode: Continuous type: HTTP intervalSeconds: 3 failureThreshold: 2 http: url: http://second.example.com method: GET criteria: statusCode: "200" - name: workflow-network-chaos templateType: NetworkChaos deadline: 180s networkChaos: direction: to action: delay mode: all selector: labelSelectors: "app": "http-server-second" delay: latency: "9000ms"
Save and close the file.
The above Chaos Workflow performs a continuous status check on the HTTP endpoint
http://second.example.com. When the status check fails, the workflow aborts and introduces network chaos by delaying incoming traffic to pods with theapp=http-server-secondlabel. Within the configuration:name: networkchaos-statuscheck-workflow: Specifies the Chaos Workflow name.entry: the-entry: Specifies the workflow starting point.templateType: Parallel: Executes the template tasks in parallel.deadline: 180s: Sets a deadline of180 secondsto complete the task.children: Specifies the child templates to execute in parallel.workflow-status-check: Defines the first child template that performs the status check.workflow-network-chaos: Defines the second child template that introduces network chaos.abortWithStatusCheck: true: Stops the workflow when the status check fails.mode: Continuous: Enables the status monitoring process to continue up to the deadline.type: HTTP: Sets an HTTP request as the status check type.intervalSeconds: 3: Sets the status check interval between attempts to3seconds.failureThreshold: 2: Marks the status check as failed if two consecutive failures occur.http: Sets the HTTP status check parameters.url: http://second.example.com: Sets the target HTTP endpoint.method: GET: Enabled the GET HTTP request method.criteria: Specifies the status check result determination criteria.statusCode: "200": Marks the status check as successful when the HTTP response status code is200.direction:: Specifies the direction of network chaos. The valuetoapplies the experiment on incoming traffic.action:: Sets the network chaos execution type,delayenables delays in network traffic.mode: all: Specifies that network chaos will affect all pods matching the selector.selector: Specifies the target pods affected by network chaos.labelSelectors: Specifies the target labels to use when selecting the cluster pods."app":: Selects the target pods based on the label value,http-server-secondenables the experiment on the second HTTP service pods.delay: Sets the network delay parameters.latency: "9000ms": Sets the network delay's latency to9000milliseconds.
Apply the workflow configuration to your cluster.
console$ kubectl apply -f networkchaos-statuscheck-workflow.yaml
View all workflows and verify that the new resource is available in your cluster.
console$ kubectl get workflow
Output:
NAME                                AGE
networkchaos-statuscheck-workflow   7s
View all workflow nodes associated with the Chaos Workflow
networkchaos-statuscheck-workflow.console$ kubectl get workflownode --selector="chaos-mesh.org/workflow=networkchaos-statuscheck-workflow"
Output:
NAME                           AGE
the-entry-wjvjm                45s
workflow-network-chaos-ndch6   45s
workflow-status-check-jmbz2    45s
Describe the status, metadata and events associated with any of the workflow nodes. For example,
the-entry-wjvjm.console$ kubectl describe workflownode the-entry-wjvjm
Your output should be similar to the one below:
Type    Reason           Age   From                                Message

----    ------           ----  ----                                -------

Normal  NodesCreated     69s   workflow-parallel-node-reconciler   child nodes created, workflow-status-check-jmbz2,workflow-network-chaos-ndch6
Normal  WorkflowAborted  58s   workflow-abort-workflow-reconciler  abort the node because workflow networkchaos-statuscheck-workflow aborted
Based on the above output, the status check fails early and aborts the Workflow because of a high latency value of
9000 ms(9 seconds).Delete the above Workflow from the Kubernetes cluster to test a lower latency value.
console$ kubectl delete -f networkchaos-statuscheck-workflow.yaml
Open the Workflow configuration file and set the latency value of the
NetworkChaosto a much smaller value.console$ nano networkchaos-statuscheck-workflow.yaml
Find the
delaysection and change the latency value from9000msto60ms.yamldelay: latency: "60ms"
Apply the modified Workflow to your cluster.
console$ kubectl apply -f networkchaos-statuscheck-workflow.yaml
Wait for at least
180seconds (3 minutes) which is the specified Workflow deadline value and view the workflow events.console$ kubectl describe workflow networkchaos-statuscheck-workflow
Output:
Events:
 Type    Reason                Age   From                       Message

 ----    ------                ----  ----                       -------

 Normal  EntryCreated          3m    workflow-entry-reconciler  entry node created, entry node the-entry-rgb9j
 Normal  WorkflowAccomplished  1s    workflow-entry-reconciler  workflow accomplished
Based on the above output, the workflow runs successfully after the specified deadline.
Conclusion
You have deployed Chaos Mesh on a Vultr Kubernetes Engine (VKE) cluster and utilized the application features to orchestrate chaos experiments. Chaos Mesh provides valuable insights into the Kubernetes cluster behavior to enhance the general infrastructure reliability and availability of all resources. For more information, visit the Chaos Mesh documentation.