
How to Optimize GPU Resource Planning with NVIDIA Dynamo
GPU resource allocation for LLM inference presents complex optimization challenges. Workloads exhibit variable request patterns, unpredictable sequence lengths, and strict latency requirements, making static GPU allocation inefficient. Overprovisioning wastes expensive compute resources, while underprovisioning violates service level agreements (SLAs) and degrades user experience.
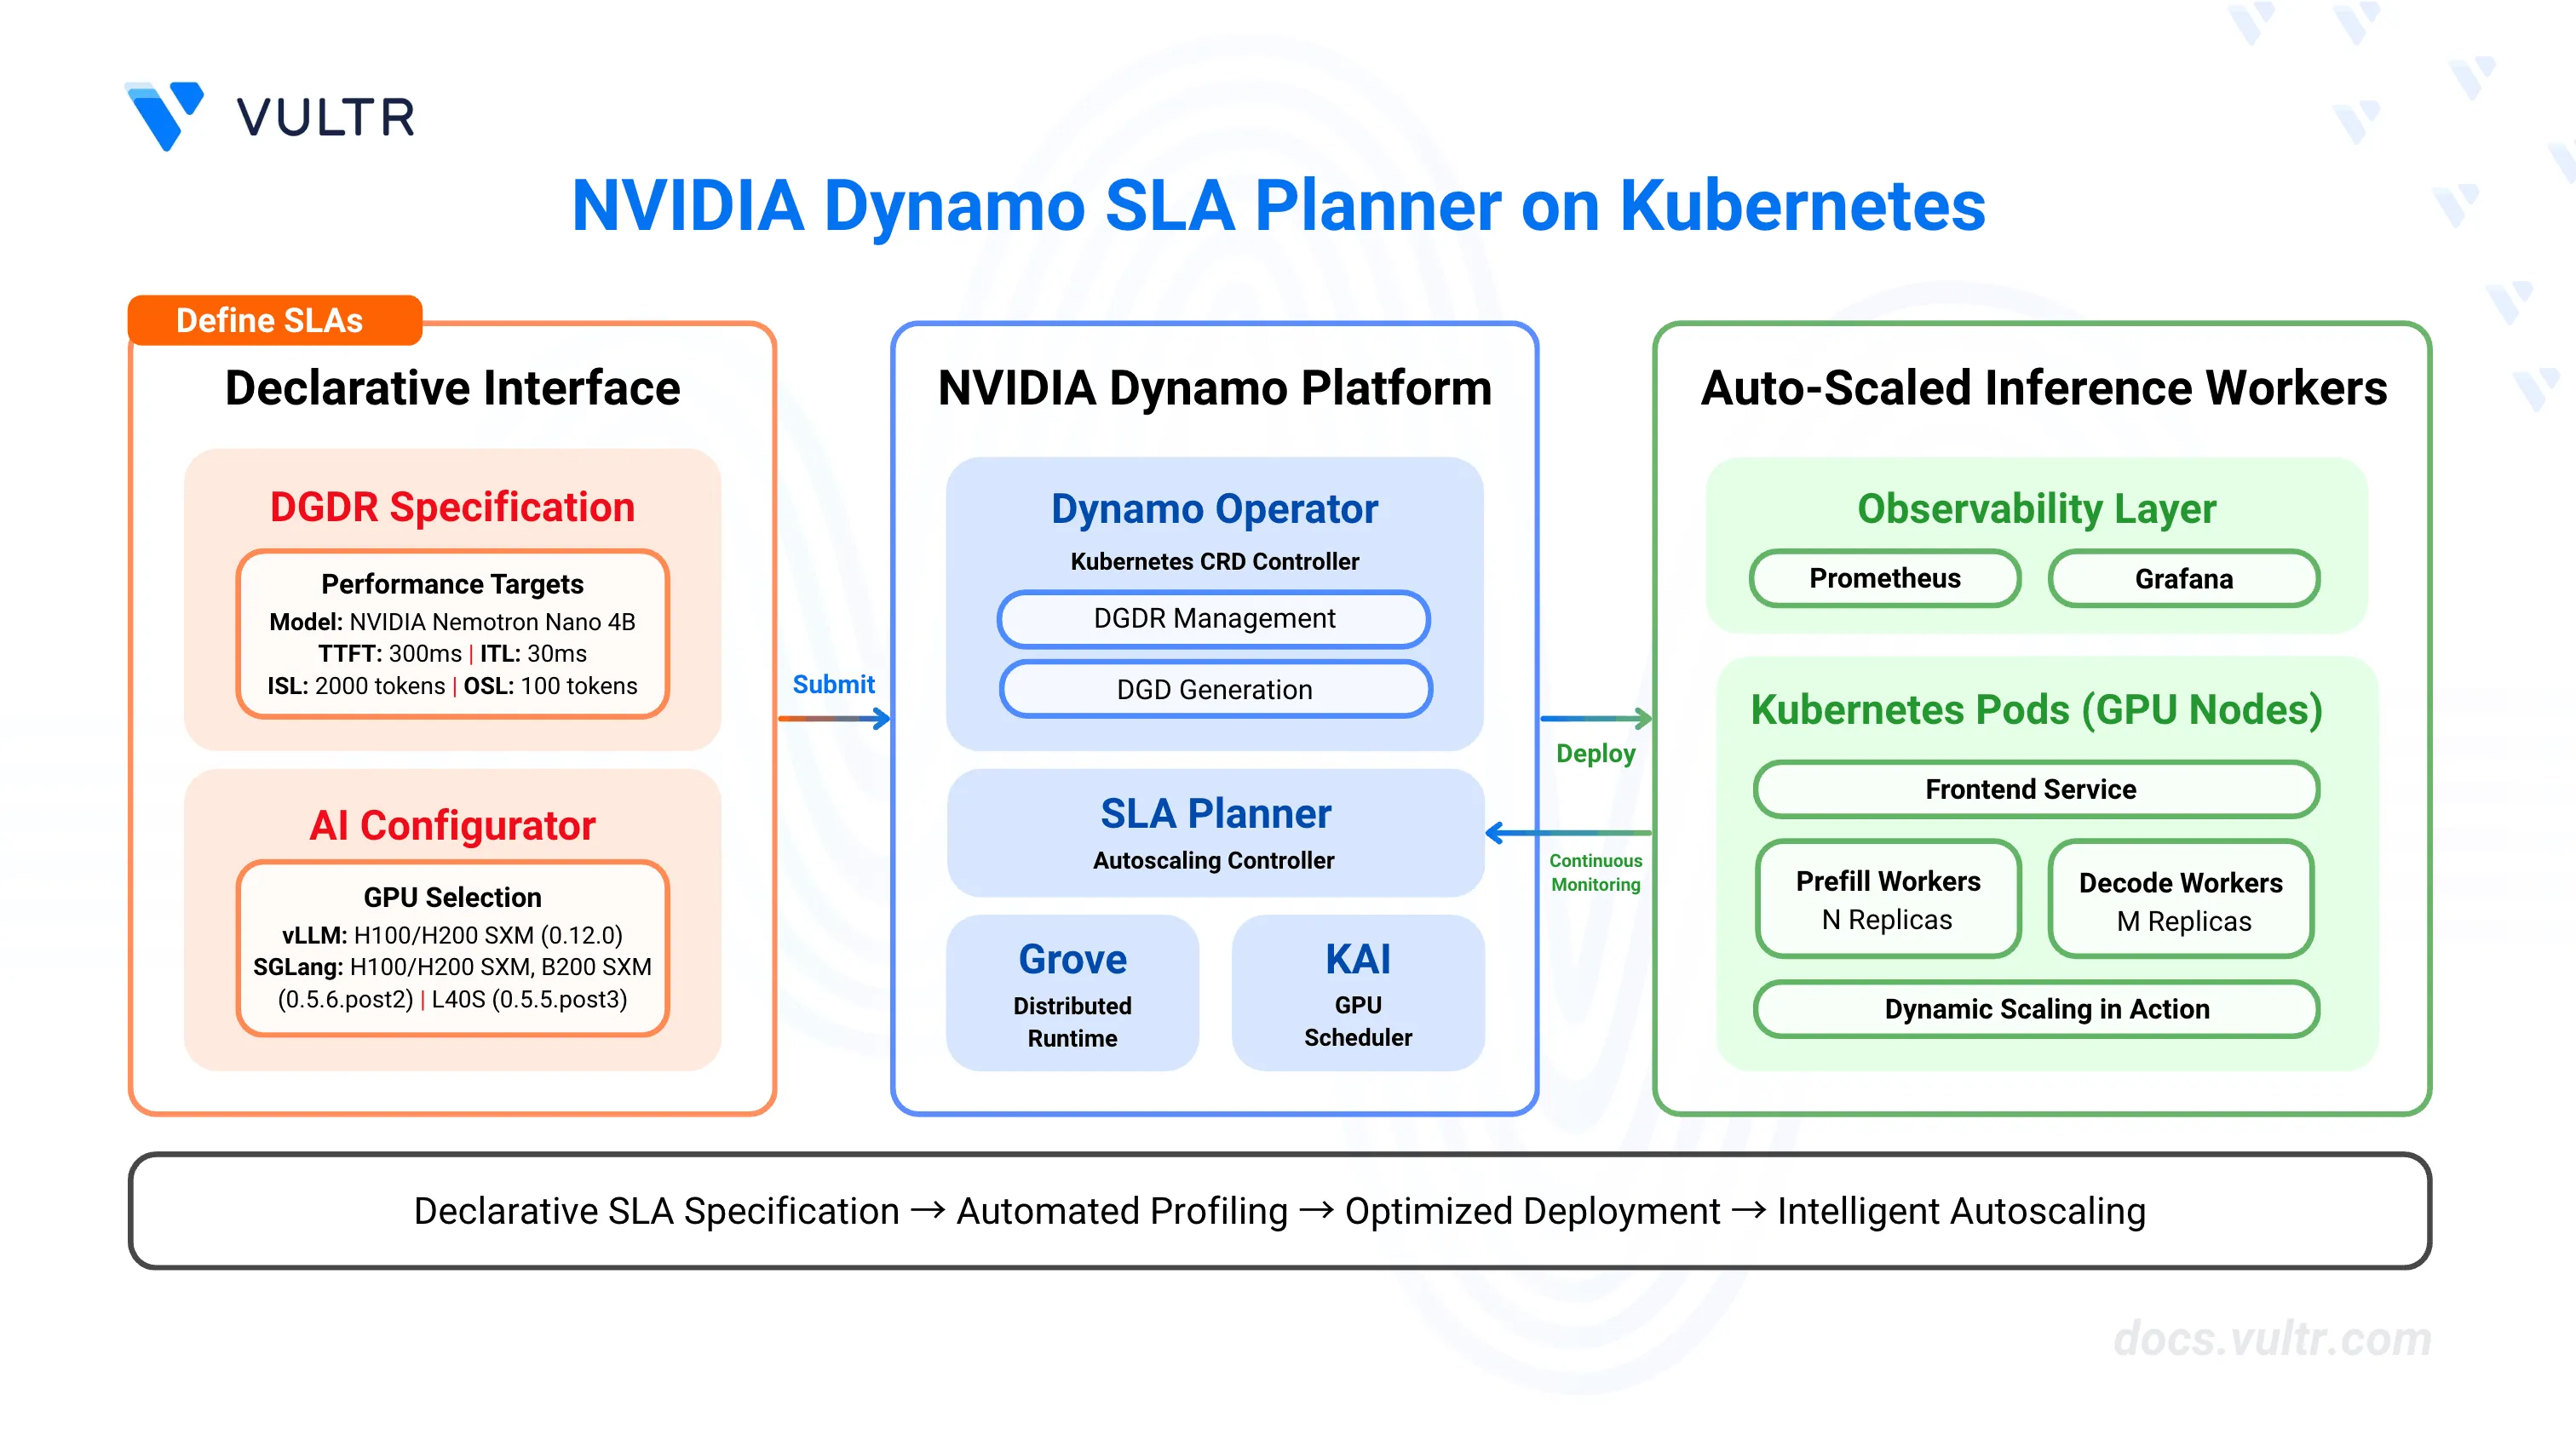
NVIDIA Dynamo's SLA Planner automates GPU resource management through SLA-driven profiling and intelligent autoscaling. The planner analyzes performance requirements (time-to-first-token, inter-token latency), profiles workload characteristics, and dynamically adjusts GPU worker replicas to meet latency targets while minimizing resource consumption. It integrates with Prometheus for metrics collection and uses predictive models (ARIMA, Kalman filter, Prophet) to forecast load patterns and proactively scale resources.
This guide covers the deployment of Dynamo's SLA Planner on Kubernetes, including infrastructure setup with Prometheus monitoring, DynamoGraphDeploymentRequest (DGDR) configuration for automated profiling and deployment, and Grafana dashboard integration for visualizing scaling decisions and performance metrics.
Prerequisites
Before you begin, ensure you:
- Have access to a Kubernetes cluster with NVIDIA GPUs configured with the NVIDIA GPU Operator. Use a cluster with at least 2 GPU nodes.
- Install kubectl and configure it to access your cluster.
- Install Helm 3 for package management.
- Install jq for JSON processing in command-line operations.
- Create an NVIDIA NGC account and generate an NGC API key with NGC Catalog access for pulling container images.
- Create a Hugging Face account and generate an access token for gated models like Llama.
- Have cluster-admin permissions to install Custom Resource Definitions (CRDs) and create namespaces.
Key Components
This deployment uses several components that work together to provide automated GPU resource planning.
NVIDIA Dynamo Platform provides the orchestration layer with the Dynamo Operator that manages DynamoGraphDeployment (DGD) and DynamoGraphDeploymentRequest (DGDR) resources. The operator automates the profiling, configuration generation, and deployment lifecycle.
SLA Planner acts as the autoscaling controller that monitors inference metrics from Prometheus and adjusts worker replica counts to meet SLA targets. It uses load predictors (constant, ARIMA, Kalman, or Prophet) to forecast request rates and sequence lengths, then calculates optimal GPU allocations based on TTFT (time-to-first-token) and ITL (inter-token latency) requirements.
DynamoGraphDeploymentRequest (DGDR) serves as the declarative interface for deploying models with performance constraints. Users specify the model name, backend type (vLLM, SGLang, or TensorRT-LLM), SLA targets, and container images. The operator automatically profiles the configuration and generates an optimized DynamoGraphDeployment.
DynamoGraphDeployment (DGD) defines the low-level implementation details for a deployed model, including frontend services, prefill workers, decode workers, and the SLA planner component. The DGDR controller automatically generates DGDs with optimized tensor parallelism configurations, resource allocations, and scaling parameters based on profiling results.
Prometheus collects inference metrics from the Dynamo frontend, including request counts, TTFT, ITL, input sequence length (ISL), and output sequence length (OSL). The planner queries these metrics every adjustment interval to make scaling decisions.
Grafana visualizes planner decisions, worker counts, GPU usage, observed metrics versus predicted metrics, and correction factors. The Dynamo Planner Dashboard provides real-time visibility into autoscaling behavior.
Verify GPU Availability
Before deploying the Dynamo Platform, confirm that your Kubernetes cluster has GPU nodes with allocatable resources. The platform requires accessible GPUs for both the profiling phase and ongoing inference workloads.
List GPU nodes in your cluster.
console$ kubectl get nodes -o json | jq '.items[] | select(.status.capacity."nvidia.com/gpu") | {name: .metadata.name, gpus: .status.capacity."nvidia.com/gpu"}'
The output displays nodes with available GPUs.
json{ "name": "gpu-node-1", "gpus": "2" } { "name": "gpu-node-2", "gpus": "2" }
Verify GPU resources are allocatable.
console$ kubectl describe nodes | grep -A 5 "nvidia.com/gpu"
The output displays allocatable GPU counts for each node. Ensure at least one node shows
nvidia.com/gpu: 1or higher under the Allocatable section.
Label GPU Nodes
The Dynamo Operator uses node labels to identify GPU-enabled nodes for scheduling inference workloads. Apply the required label to all GPU nodes in your cluster to enable proper resource discovery.
Check if GPU nodes are already labeled.
console$ kubectl get nodes --show-labels | grep nvidia.com/gpu.present
If the output displays nodes with the
nvidia.com/gpu.present=truelabel, skip to the next section. If no output appears, proceed with labeling.Identify your GPU nodes.
console$ kubectl get nodes
The output lists all cluster nodes.
Label each GPU node with the Dynamo GPU label. Replace
NODE_NAMEwith your GPU node name.console$ kubectl label node NODE_NAME nvidia.com/gpu.present=true
Repeat this command for each GPU node in your cluster.
Verify the labels were applied.
console$ kubectl get nodes --show-labels | grep nvidia.com/gpu.present
The output displays nodes with the GPU label.
Run Pre-Deployment Checks
The Dynamo repository includes a pre-deployment validation script that checks your cluster's configuration against platform requirements. Run this script to identify and resolve issues before installation.
Clone the Dynamo repository if you haven't already.
console$ git clone https://github.com/ai-dynamo/dynamo.git $ cd dynamo
Check out the latest stable release. Visit the Dynamo releases page to find the latest version.
console$ git checkout release/0.9.0
Run the pre-deployment check script.
console$ ./deploy/pre-deployment/pre-deployment-check.shThe script validates kubectl connectivity, default StorageClass configuration, GPU resources, and GPU Operator installation.
========================================
  Dynamo Pre-Deployment Check Script
========================================

✅ kubectl Connectivity: PASSED
✅ Default StorageClass: PASSED
✅ Cluster GPU Resources: PASSED
✅ GPU Operator: PASSED

All pre-deployment checks passed!
Your cluster is ready for Dynamo deployment.
If any checks fail, review the error messages and resolve the issues before proceeding.
Install Prometheus
Prometheus serves as the metrics backbone for Dynamo's autoscaling. The SLA Planner queries Prometheus for real-time inference metrics to make scaling decisions.
Add the Prometheus Helm repository.
console$ helm repo add prometheus-community https://prometheus-community.github.io/helm-charts $ helm repo update
Install the kube-prometheus-stack with configuration for Dynamo metric scraping.
console$ helm install prometheus -n monitoring --create-namespace prometheus-community/kube-prometheus-stack \ --set prometheus.prometheusSpec.podMonitorSelectorNilUsesHelmValues=false \ --set-json 'prometheus.prometheusSpec.podMonitorNamespaceSelector={}' \ --set prometheus.prometheusSpec.probeNamespaceSelector.matchLabels=null
The configuration enables Prometheus to scrape PodMonitor resources from all namespaces, allowing it to collect metrics from Dynamo frontend services.
Verify Prometheus is running.
console$ kubectl get pods -n monitoring -l app.kubernetes.io/name=prometheus
The output displays the Prometheus server pod in the Running state.
Install Dynamo Platform
The Dynamo Platform provides the core orchestration components for SLA-driven inference deployments. This installation includes Custom Resource Definitions (CRDs) for DGD and DGDR resources, the Dynamo Operator for lifecycle management, Grove distributed runtime, and the KAI scheduler.
Set environment variables for the installation.
console$ export NAMESPACE=dynamo-system $ export RELEASE_VERSION=0.9.0
Navigate to the home directory.
console$ cd ~
Fetch the Dynamo CRDs Helm chart.
console$ helm fetch https://helm.ngc.nvidia.com/nvidia/ai-dynamo/charts/dynamo-crds-${RELEASE_VERSION}.tgz
Install the CRDs.
console$ helm install dynamo-crds dynamo-crds-${RELEASE_VERSION}.tgz
The command installs the Custom Resource Definitions required for Dynamo deployments.
Fetch the Dynamo Platform Helm chart.
console$ helm fetch https://helm.ngc.nvidia.com/nvidia/ai-dynamo/charts/dynamo-platform-${RELEASE_VERSION}.tgz
Install the Dynamo Platform with the operator enabled and Prometheus endpoint configured.
console$ helm upgrade --install dynamo-platform dynamo-platform-${RELEASE_VERSION}.tgz \ --namespace ${NAMESPACE} \ --create-namespace \ --set dynamo-operator.controllerManager.manager.image.tag=0.9.0 \ --set grove.enabled=true \ --set kai-scheduler.enabled=true \ --set nats.reloader.image.tag=0.22.3 \ --set prometheusEndpoint=http://prometheus-kube-prometheus-prometheus.monitoring.svc.cluster.local:9090
The command configures the following components:
--namespace ${NAMESPACE}and--create-namespace: Installs the platform in thedynamo-systemnamespace, creating it if it doesn't exist.--set dynamo-operator.controllerManager.manager.image.tag=0.9.0: Specifies the Dynamo Operator version that manages DGD and DGDR lifecycle operations.--set grove.enabled=true: Enables Grove, the distributed runtime that coordinates communication between frontend and worker services.--set kai-scheduler.enabled=true: Enables the KAI (Kubernetes AI) scheduler for advanced GPU scheduling and resource allocation.--set nats.reloader.image.tag=0.22.3: Specifies the NATS configuration reloader version that automatically reloads NATS server configuration changes without downtime.--set prometheusEndpoint=...: Configures the SLA Planner to query inference metrics from the Prometheus service in the monitoring namespace.
If the installation fails with a Grove webhook certificate conflict error, uninstall the release and reinstall:NoteThen run the installation command again. The warningconsole$ helm uninstall dynamo-platform --namespace ${NAMESPACE}
"tls: failed to find any PEM data in certificate input"is harmless and can be ignored.Verify the operator is running.
console$ kubectl get pods -n ${NAMESPACE} -l app.kubernetes.io/name=dynamo-operator
The output displays the operator pod in the Running state.
NAME                                                              READY   STATUS      RESTARTS   AGE
dynamo-platform-dynamo-operator-controller-manager-77464cd6pcjt   2/2     Running     0          45s
Create Image Pull Secrets
Dynamo deployments require authentication credentials for pulling container images from NVIDIA NGC and downloading models from Hugging Face. Create Kubernetes secrets to store these credentials securely.
Export your NGC API key. Replace
YOUR_NGC_API_KEYwith your NGC API key from the NGC portal.console$ export NGC_API_KEY=YOUR_NGC_API_KEY
Export your Hugging Face token. Replace
YOUR_HF_TOKENwith your Hugging Face access token.console$ export HF_TOKEN=YOUR_HF_TOKEN
Create a Docker registry secret for NGC access using the exported variable.
console$ kubectl create secret docker-registry nvcr-imagepullsecret \ --docker-server=nvcr.io \ --docker-username='$oauthtoken' \ --docker-password=${NGC_API_KEY} \ -n ${NAMESPACE}
Create a Hugging Face token secret for model downloads using the exported variable.
console$ kubectl create secret generic hf-token-secret \ --from-literal=HF_TOKEN=${HF_TOKEN} \ -n ${NAMESPACE}
Select AI Configurator System and Backend Version
The AI Configurator performs offline profiling to generate optimal deployment configurations without running actual workloads. The aicSystem parameter specifies your GPU hardware type, and the aicBackendVersion parameter specifies the inference backend version for profiling data.
For the most up-to-date version information and supported features, refer to the AI Configurator supported features documentation.
Available GPU Systems
The AI Configurator supports the following GPU systems:
| System | Description | Supported Backends |
|---|---|---|
a100_sxm |
NVIDIA A100 SXM | TensorRT-LLM |
b200_sxm |
NVIDIA B200 SXM | SGLang, TensorRT-LLM |
gb200_sxm |
NVIDIA GB200 SXM | TensorRT-LLM |
h100_sxm |
NVIDIA H100 SXM | vLLM, SGLang, TensorRT-LLM |
h200_sxm |
NVIDIA H200 SXM | vLLM, SGLang, TensorRT-LLM |
l40s |
NVIDIA L40S | SGLang, TensorRT-LLM |
Backend Version Compatibility
Each GPU system and backend combination has specific supported versions based on pre-profiled performance data.
vLLM Backend
| GPU System | Supported Versions |
|---|---|
| H100 SXM | 0.12.0 |
| H200 SXM | 0.12.0 |
Example configuration for vLLM:
sweep:
  useAiConfigurator: true
  aicSystem: h200_sxm
  aicBackendVersion: "0.12.0"
SGLang Backend
| GPU System | Supported Versions |
|---|---|
| B200 SXM | 0.5.6.post2 |
| H100 SXM | 0.5.6.post2 |
| H200 SXM | 0.5.6.post2 |
| L40S | 0.5.5.post3 |
Example configuration for SGLang:
sweep:
  useAiConfigurator: true
  aicSystem: h200_sxm
  aicBackendVersion: "0.5.6.post2"
TensorRT-LLM Backend
| GPU System | Supported Versions |
|---|---|
| A100 SXM | 1.0.0 |
| B200 SXM | 1.0.0rc6, 1.2.0rc5 |
| GB200 SXM | 1.0.0rc6, 1.2.0rc5 |
| H100 SXM | 1.0.0rc3, 1.2.0rc5 |
| H200 SXM | 1.0.0rc3, 1.2.0rc5 |
| L40S | 1.0.0 |
Example configuration for TensorRT-LLM:
sweep:
  useAiConfigurator: true
  aicSystem: h200_sxm
  aicBackendVersion: "1.2.0rc5"
Selecting the Correct Configuration
Match your configuration to your cluster's GPU hardware:
- Identify your GPU type: Use
kubectl describe nodesto check GPU model information. - Select matching aicSystem: Choose the system code that matches your GPU hardware.
- Select compatible backend version: Use the version from the tables above for your chosen backend and GPU system.
If you attempt to use an unsupported combination, the profiling job will fail with an error indicating no profiling data is available for that configuration.
Deploy a Model with SLA-Driven Profiling
DynamoGraphDeploymentRequests (DGDRs) provide a declarative interface for deploying models with specific performance targets. Specify your latency requirements—TTFT and ITL—and the operator automatically profiles the workload using AI Configurator to generate an optimized deployment configuration.
Create a DGDR manifest file with SLA specifications for the NVIDIA Nemotron Nano 4B model using the vLLM backend.
console$ cat << 'EOF' > nemotron-nano-4b-dgdr.yaml apiVersion: nvidia.com/v1alpha1 kind: DynamoGraphDeploymentRequest metadata: name: nemotron-nano-sla spec: model: nvidia/Llama-3.1-Nemotron-Nano-4B-v1.1 backend: vllm autoApply: false profilingConfig: profilerImage: nvcr.io/nvidia/ai-dynamo/vllm-runtime:0.9.0-cuda13 config: sla: isl: 2000 osl: 100 ttft: 300.0 itl: 30.0 sweep: useAiConfigurator: true aicSystem: h200_sxm aicHfId: nvidia/Llama-3.1-Nemotron-Nano-4B-v1.1 aicBackendVersion: "0.12.0" planner: plannerMinEndpoint: 1 plannerMaxGpuBudget: 4 plannerAdjustmentInterval: 30 deploymentOverrides: workersImage: nvcr.io/nvidia/ai-dynamo/vllm-runtime:0.9.0-cuda13 name: vllm-disagg EOF
The manifest specifies:
- Model: NVIDIA Nemotron Nano 4B, a compact instruction-tuned model suitable for efficient inference.
- SLA targets: Average input sequence length (ISL) of 2000 tokens, output sequence length (OSL) of 100 tokens, time-to-first-token (TTFT) of 300ms, and inter-token latency (ITL) of 30ms.
- AI Configurator profiling: Uses offline profiling with AI Configurator for H200 SXM GPUs, completing in 20-30 seconds instead of 2-4 hours for online profiling.
- Planner configuration: Minimum 1 endpoint (worker), maximum 4 GPUs budget, and 30-second adjustment intervals for faster scaling demonstrations.
- Manual deployment:
autoApply: falseallows you to review and modify the generated DGD configuration before deployment.
AI Configurator System Selection: TheNoteaicSystemparameter must match your GPU hardware type. Available options are:a100_sxm,b200_sxm,gb200_sxm,h100_sxm,h200_sxm, andl40s. TheaicBackendVersionparameter must match the available version for your selected system and backend combination. For vLLM backend: H100/H200 SXM supports version0.12.0. For SGLang: H100/H200 SXM and B200 SXM support version0.5.6.post2, L40S supports0.5.5.post3. For TensorRT-LLM: consult the AI Configurator documentation for supported versions.Apply the DGDR manifest.
console$ kubectl apply -f nemotron-nano-4b-dgdr.yaml -n ${NAMESPACE}
Monitor the DGDR status.
console$ kubectl get dgdr nemotron-nano-sla -n ${NAMESPACE} -w
The DGDR transitions through states:
Pending→Profiling→Ready. The profiling phase with AI Configurator completes in approximately 20-30 seconds. SinceautoApply: false, the operator does not automatically create the DGD.NAME MODEL BACKEND STATE DGD-STATE AGE nemotron-nano-sla nvidia/Llama-3.1-Nemotron-Nano-4B-v1.1 vllm Pending 5s nemotron-nano-sla nvidia/Llama-3.1-Nemotron-Nano-4B-v1.1 vllm Profiling 10s nemotron-nano-sla nvidia/Llama-3.1-Nemotron-Nano-4B-v1.1 vllm Ready 35sView detailed DGDR status and events.
console$ kubectl describe dgdr nemotron-nano-sla -n ${NAMESPACE}
The output displays profiling results and the generated DGD configuration in the
status.generatedDeploymentfield.
Extract and Deploy the Generated DGD
The profiling process produces an optimized DynamoGraphDeployment (DGD) stored in the DGDR status. Before deployment, extract this configuration and add required environment variables for Grove distributed runtime coordination and the --trust-remote-code flag for worker services.
Extract the generated DGD configuration to a file.
console$ kubectl get dgdr nemotron-nano-sla -n ${NAMESPACE} -o jsonpath='{.status.generatedDeployment}' > nemotron-nano-dgd-raw.yaml
Add required Pod metadata environment variables and the
--trust-remote-codeflag to worker services using jq. These modifications enable Grove distributed runtime coordination and allow worker services to load models with custom code.console$ cat nemotron-nano-dgd-raw.yaml | jq '.spec.services |= with_entries( .value.extraPodSpec.mainContainer.env = [ {"name":"POD_UID","valueFrom":{"fieldRef":{"fieldPath":"metadata.uid"}}}, {"name":"POD_NAME","valueFrom":{"fieldRef":{"fieldPath":"metadata.name"}}}, {"name":"POD_NAMESPACE","valueFrom":{"fieldRef":{"fieldPath":"metadata.namespace"}}}, {"name":"POD_IP","valueFrom":{"fieldRef":{"fieldPath":"status.podIP"}}} ] | if .value.componentType == "worker" then if (.value.extraPodSpec.mainContainer.args // []) | any(. == "--trust-remote-code") | not then .value.extraPodSpec.mainContainer.args += ["--trust-remote-code"] else . end else . end )' > nemotron-nano-dgd.yaml
The command pipes the DGD configuration through jq to inject Pod metadata environment variables into all services and add the
--trust-remote-codeflag only to worker service arguments (VllmPrefillWorker and VllmDecodeWorker), saving the result to a new file.Apply the modified DGD configuration to deploy the model.
console$ kubectl apply -f nemotron-nano-dgd.yaml -n ${NAMESPACE}
The operator creates the frontend, prefill workers, decode workers, and planner components.
Verify the DynamoGraphDeployment was created.
console$ kubectl get dgd -n ${NAMESPACE}
The output displays the deployed DGD resource.
NAME          AGE
vllm-disagg   30s
Check the frontend and worker pods are running.
console$ kubectl get pods -n ${NAMESPACE} -l app.kubernetes.io/part-of=vllm-disagg
The output displays frontend, prefill worker, decode worker, and planner pods in the Running state. Wait until all pods show
Runningstatus before proceeding.Initial deployment may take several minutes as worker pods download the model and load it into GPU memory. Deployment time varies based on model size—larger models require more time. Monitor pod status withNotekubectl get pods -n ${NAMESPACE} -wto track progress.
Test the Deployment
Verify the deployment works correctly by sending a test inference request to the frontend service. Use port-forwarding to expose the service locally and send a chat completion request through the OpenAI-compatible API.
Get the frontend service name.
console$ kubectl get svc -n ${NAMESPACE} -l nvidia.com/dynamo-discovery-backend=kubernetes | grep frontend
The output displays the frontend service.
vllm-disagg-frontend ClusterIP 10.43.69.246 <none> 8000/TCP 2mForward the frontend service to your local machine.
console$ kubectl port-forward -n ${NAMESPACE} svc/vllm-disagg-frontend 8000:8000
The command forwards port 8000 from the frontend service to
localhost:8000. Keep this terminal session running.In a new terminal, send a test inference request.
console$ curl -X POST http://localhost:8000/v1/chat/completions \ -H "Content-Type: application/json" \ -d '{ "model": "nvidia/Llama-3.1-Nemotron-Nano-4B-v1.1", "messages": [ { "role": "user", "content": "Explain GPU resource planning in one sentence." } ], "max_tokens": 50, "temperature": 0.7 }'
The command sends a chat completion request to the model. The frontend routes the request through the disaggregated prefill and decode workers, and returns the generated response.
Press
Ctrl+Cin the port-forward terminal to stop forwarding.
Install Grafana Dashboard
The Dynamo Planner Dashboard provides real-time visualization of autoscaling behavior, including worker replica counts, GPU utilization, observed metrics versus predictions, and correction factors.
Apply the Grafana dashboard ConfigMap.
console$ kubectl apply -n monitoring -f https://raw.githubusercontent.com/ai-dynamo/dynamo/release/0.9.0/deploy/observability/k8s/grafana-planner-dashboard-configmap.yaml
Expose the Grafana service using a NodePort for quick testing.
console$ kubectl patch svc prometheus-grafana \ -n monitoring \ -p '{"spec": {"type": "NodePort"}}'
NodePort is for testing only. For production deployments with secure external access, configure Gateway API with TLS encryption to expose Grafana with HTTPS ingress and certificate management.NoteGet the NodePort assigned to Grafana.
console$ kubectl get svc prometheus-grafana -n monitoring -o jsonpath='{.spec.ports[0].nodePort}'; echo
The output displays the port number (e.g.,
31234).Retrieve the Grafana admin password.
console$ kubectl get secret prometheus-grafana -n monitoring -o jsonpath='{.data.admin-password}' | base64 -d; echo
The output displays the password. Note this for the next step.
Access Grafana in your browser. Replace
NODE_IPwith your cluster node's IP address andNODE_PORTwith the port from the previous step.http://NODE_IP:NODE_PORTLog in with username
adminand the password retrieved in the previous step.Navigate to Dashboards → Dynamo Planner Dashboard to view planner metrics.
Monitor Automatic Scaling
The SLA Planner automatically scales GPU workers based on incoming inference traffic without manual intervention. The planner continuously monitors request rates, input/output sequence lengths, TTFT, and ITL metrics from Prometheus, then adjusts prefill and decode worker replicas every adjustment interval (30 seconds in this configuration) to meet SLA targets.
Understanding Planner Behavior
As your application receives inference requests, the planner:
- Collects Metrics: Gathers request rates, sequence lengths, and latency metrics from the Dynamo frontend via Prometheus.
- Predicts Load: Uses the configured load predictor (constant, ARIMA, Kalman, or Prophet) to forecast future traffic patterns.
- Calculates Requirements: Determines optimal worker counts needed to meet TTFT and ITL SLA targets based on predicted load.
- Scales Workers: Increases or decreases prefill and decode worker replicas by updating the DynamoGraphDeployment.
- Applies Corrections: Adjusts predictions based on observed performance versus expected performance using correction factors.
The planner scales up when request rates increase or sequence lengths grow, and scales down during periods of low traffic to minimize GPU consumption while maintaining SLA compliance.
Viewing Scaling Metrics in Grafana
The Dynamo Planner Dashboard displays real-time autoscaling behavior and performance metrics.
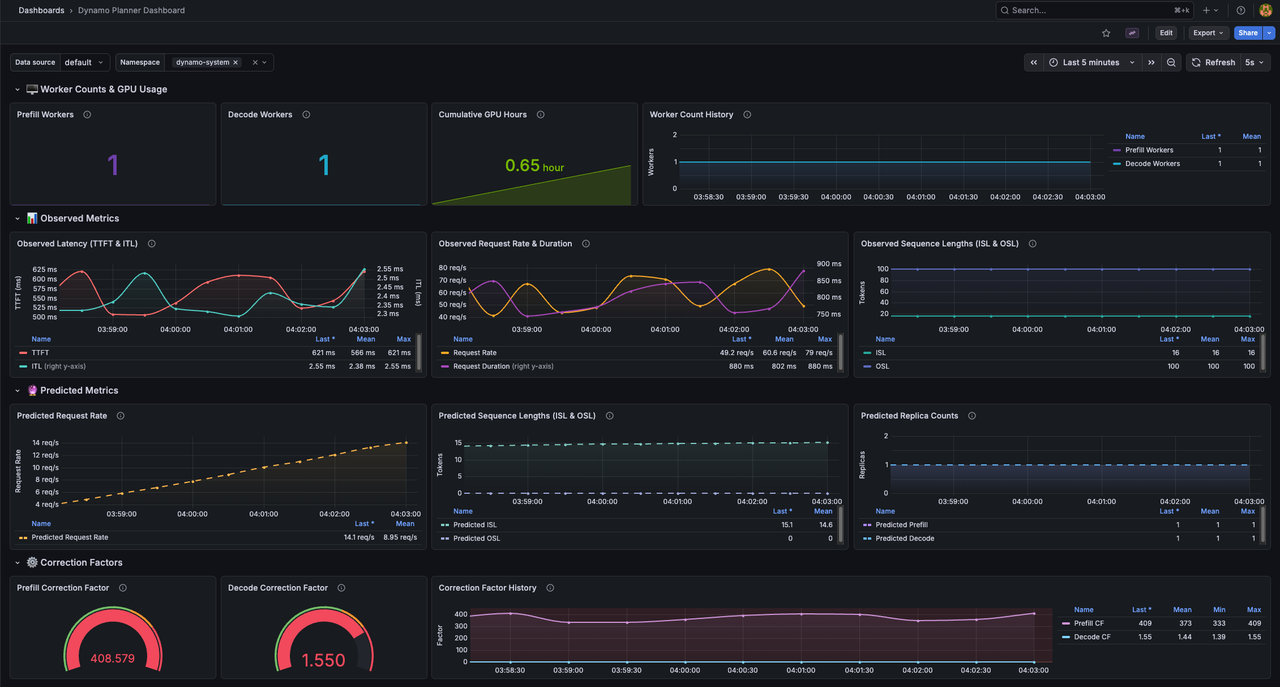
The dashboard visualizes:
- Worker Counts: Current number of prefill and decode worker replicas, updated after each scaling decision.
- GPU Budget: Cumulative GPU hours consumed over time, showing resource utilization trends.
- Request Metrics: Observed request rates, TTFT, and ITL values from Prometheus queries.
- Load Predictions: Forecasted request rates and sequence lengths from the configured predictor model.
- Correction Factors: Multipliers applied to predictions based on actual versus expected performance.
- Scaling Decisions: Timeline of worker count changes with reasons (e.g., "Scaling to meet ITL target").
Use the Namespace dropdown at the top of the dashboard to filter metrics for your specific deployment namespace (dynamo-system in this guide).
Monitoring Planner Logs
View planner decision logs to understand scaling actions in detail.
$ kubectl logs -n ${NAMESPACE} -l app.kubernetes.io/name=vllm-disagg-0-planner,app.kubernetes.io/part-of=vllm-disagg --tail=50 -f
The logs display real-time scaling decisions with observed metrics, predictions, and replica calculations.
2026-02-28T00:01:53.952354Z  INFO planner_core.run: New adjustment interval started!
2026-02-28T00:01:53.962025Z  INFO planner_core.observe_metrics: Observed num_req: 0.00 isl: 0.00 osl: 0.00
2026-02-28T00:01:53.962037Z  INFO planner_core.observe_metrics: Observed ttft: 0.00ms itl: 0.00ms
2026-02-28T00:01:53.962463Z  INFO planner_core.predict_load: Predicted load: num_req=0.00, isl=0.00, osl=0.00
2026-02-28T00:01:53.962592Z  INFO planner_core._compute_replica_requirements: Predicted number of engine replicas: prefill=1, decode=1
2026-02-28T00:01:53.966200Z  INFO kubernetes_connector.set_component_replicas: prefill component VllmPrefillWorker already at desired replica count 1, skipping
The planner logs every adjustment interval, showing observed metrics from Prometheus, load predictions, and replica adjustment decisions. As inference requests arrive, the planner scales worker replicas to meet SLA targets. Press Ctrl+C to stop following the logs.
Understanding Load Predictors
The SLA Planner uses load predictors to forecast future request patterns and proactively scale resources. Choose from four prediction models—constant, ARIMA, Kalman, or Prophet—based on your workload characteristics and traffic patterns.
Constant Predictor
The constant predictor assumes the next interval's load equals the current load. Use this for stable workloads with long adjustment intervals.
planner:
  loadPredictor: constant
ARIMA Predictor
The ARIMA predictor uses auto-ARIMA to fit optimal model parameters for time-series data with trends and seasonality.
planner:
  loadPredictor: arima
  loadPredictorLog1p: true
The loadPredictorLog1p parameter models log1p(y) instead of raw values, improving accuracy for request count predictions.
Kalman Predictor
The Kalman predictor provides fast online forecasting with smooth adaptation using a local linear trend Kalman filter.
planner:
  loadPredictor: kalman
  kalmanQLevel: 0.1
  kalmanQTrend: 0.01
  kalmanR: 1.0
Tunable parameters control responsiveness to new observations versus trust in historical trends.
Prophet Predictor
The Prophet predictor handles complex seasonal patterns and trend changes using Facebook's Prophet model.
planner:
  loadPredictor: prophet
  prophetWindowSize: 1000
  loadPredictorLog1p: true
Conclusion
You have successfully deployed NVIDIA Dynamo's SLA Planner for automated GPU resource optimization. The planner uses declarative DGDRs to specify performance requirements, automatically profiles workload characteristics, and dynamically adjusts worker replicas to meet SLA targets while minimizing GPU consumption. Prometheus integration provides metrics visibility, Grafana dashboards visualize scaling decisions, and load predictors enable proactive resource allocation based on traffic patterns. For advanced configurations, including custom load predictor parameters, manual deployment control, and virtual deployment modes, refer to the official Dynamo Planner documentation.