InfluxDB is a time-series database, which is often used to store performance metrics. When combined with Telegraf collection and Grafana visualization services, it makes an easy performance monitoring solution for VPS cloud server hosting. This tutorial explains how to set up a simple monitoring dashboard with these tools.
Prerequisites
- Deploy a Vultr Debian 10 cloud server instance.
- Create a sudo user.
- Update the Debian server.
It's good practice to use a firewall such as ufw.
1. Install InfluxDB and Telegraf
Install GnuPG.
# apt-get update
# apt-get install gpg
Download the GPG key and add the repository.
# wget -qO- https://repos.influxdata.com/influxdb.key | sudo apt-key add -
# echo "deb https://repos.influxdata.com/debian buster stable" | sudo tee -a /etc/apt/sources.list.d/influxdb.list
Install InfluxDB and Telegraf.
# apt-get update
# apt-get install influxdb telegraf
2. Configure InfluxDB
Edit the InfluxDB configuration file.
# nano /etc/influxdb/influxdb.confFind the section that starts with [http] and uncomment it.
Add these configuration statements to enable the HTTP interface on the loopback address.
[http]
enabled = true
bind-address = "127.0.0.1:8086"
auth-enabled = true
realm = "InfluxDB"
Enable InfluxDB to start at boot and start the service.
# systemctl enable influxdb
# systemctl start influxdb
Open the influx shell.
$ influxCreate an admin user. Replace yourpassword with a secure password.
> CREATE USER admin WITH PASSWORD 'yourpassword' WITH ALL PRIVILEGESLog in as admin.
> auth
username: admin
password:
Create a database for Telegraf, and a user with access to the database. Replace yourpassword with a strong password.
> CREATE USER telegraf WITH PASSWORD 'yourpassword'
> CREATE DATABASE telegraf
> GRANT ALL ON telegraf TO telegraf
Create a user for Grafana. Replace yourpassword with a strong password.
> CREATE USER grafana WITH PASSWORD 'yourpassword'
> GRANT READ ON telegraf TO grafana
Verify the users are created.
> SHOW USERS
user     admin
----     -----
admin    true
telegraf false
grafana  false
Exit the influx shell.
> exit3. Configure Telegraf
Make a backups of the default Telegraf configuration file.
# mv /etc/telegraf/telegraf.conf /etc/telegraf/telegraf.conf.oldCreate a new configuration file.
# nano /etc/telegraf/telegraf.confAdd these lines to the configuration file.
[agent]
  interval = "30s"
  round_interval = true
  metric_batch_size = 10000
  metric_buffer_limit = 10000
  collection_jitter = "0s"
  flush_interval = "10s"
  flush_jitter = "0s"
  precision = "0s"

[[outputs.influxdb]]
  urls = ["http://127.0.0.1:8086"]
  database = "telegraf"
  username = "telegraf"
  password = "yourpassword"
Replace "yourpassword" with the telegraf user password you configured earlier.
You can change the interval setting to reflect how often you'd like Telegraf to collect metrics. The example configuration collects metrics from the inputs you define every 30 seconds.
Add the inputs to the Telegraf configuration file to define the metrics for collection. You can find many examples on the Telegraf docs, but for basic system information, add these lines:
[[inputs.cpu]]
  percpu = true
  totalcpu = true
  collect_cpu_time = false
  report_active = false
[[inputs.disk]]
  ignore_fs = ["tmpfs", "devtmpfs", "devfs", "iso9660", "overlay", "aufs", "squashfs"]
[[inputs.diskio]]
[[inputs.kernel]]
[[inputs.mem]]
[[inputs.processes]]
[[inputs.swap]]
[[inputs.system]]
You can also add an interval setting to each input to specify different collection frequencies than the default.
Save and close the file.
Restart the Telegraf service.
# systemctl restart telegrafCheck the service status.
# systemctl status telegraf4. Install Grafana
Install Grafana's dependencies.
# apt-get install apt-transport-https software-properties-common wgetAdd the Grafana GPG key and apt repository.
# wget -qO- https://packages.grafana.com/gpg.key | sudo apt-key add -
# echo "deb https://packages.grafana.com/oss/deb stable main" | sudo tee -a /etc/apt/sources.list.d/grafana.list
Install Grafana.
# apt-get update
# apt-get install grafana
Enable and start the Grafana service.
# systemctl daemon-reload
# systemctl enable grafana-server
# systemctl start grafana-server
Grafana should now be running. Unblock TCP port 3000 in your firewall to allow access to the web interface. For the ufw firewall, use:
# ufw allow 3000/tcp
# ufw reload
5. Log in to Grafana
Navigate to http://[your VPS public IP]:3000/, or the server's domain name at port 3000. Log in with the default username "admin", with password "admin". Grafana prompts you to change the default password.
Connect Grafana to the InfluxDB server by clicking Data Sources under the Configuration menu on the left. Select Add data source, and then InfluxDB. Use these configuration options, specifying the username and password that you created earlier for Grafana.
Query Language: InfluxQL
URL: http://127.0.0.1:8086/
Access: Server
Database: telegraf
User: grafana
Password: yourpassword
Click Save and Test. Grafana should report that your new data source is working.
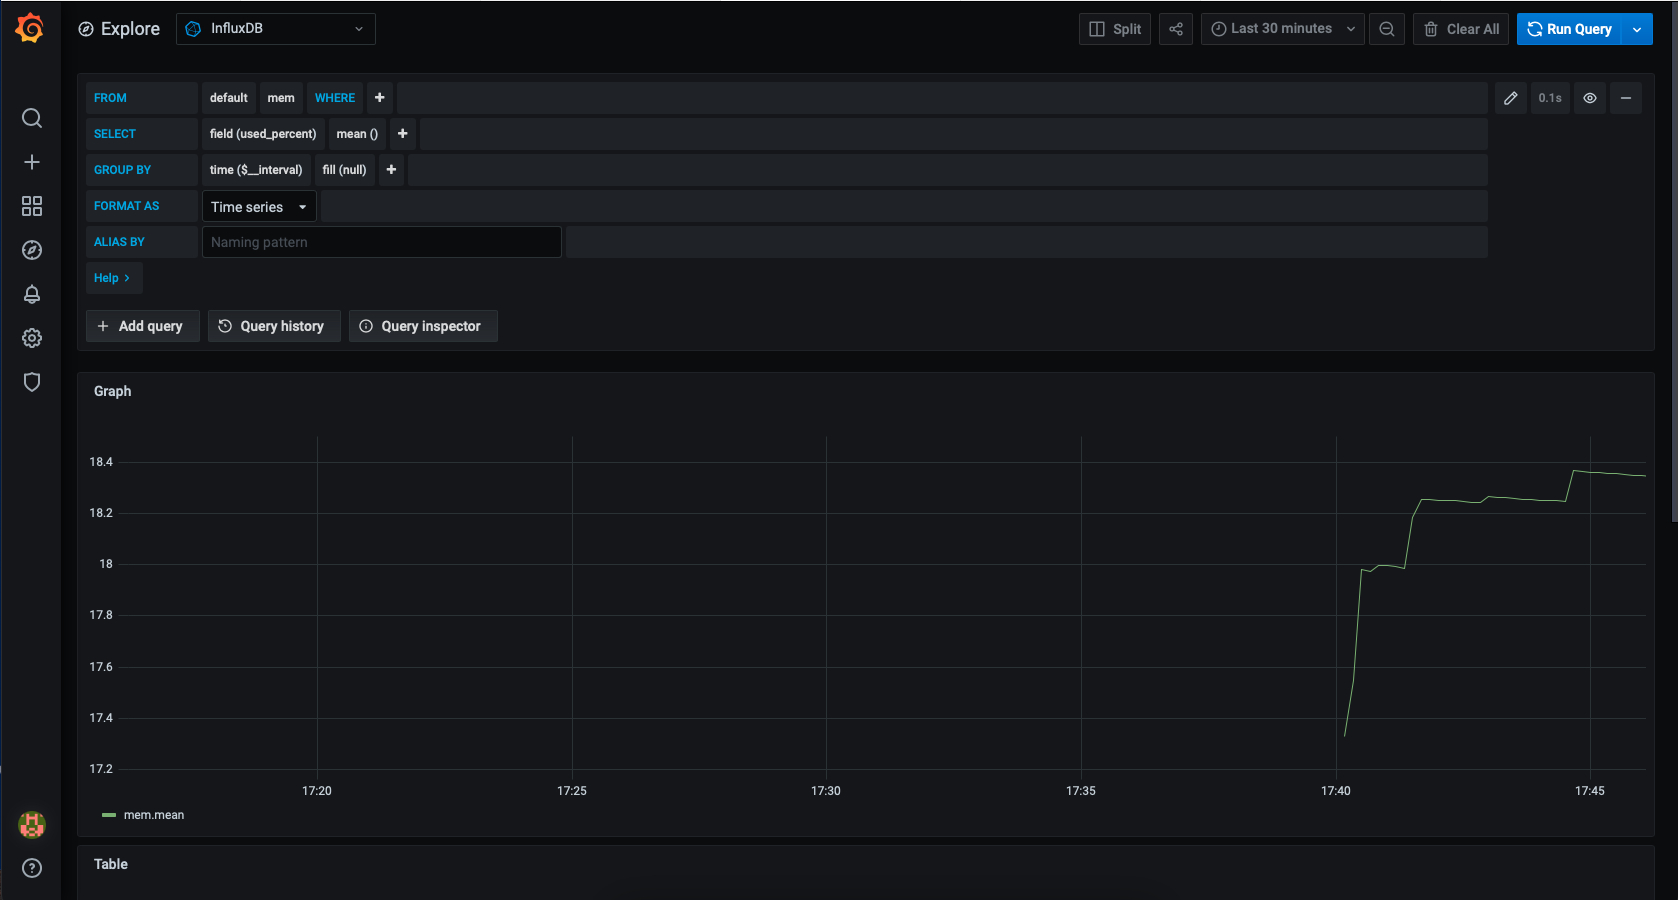
Use the Explore button on the left to create some graphs. For example, click select measurements and choose mem for memory. Under the SELECT row, choose used_percent. You should now see a graph showing your server's memory usage, using data collected by Telegraf.

To make a permanent dashboard choose the Dashboards tab and click Home at the top of the page to see a list of all dashboards.
Conclusion
There are many more input and output plugins available to monitor other applications running on your server. To expand your monitoring system, check the InfluxDB and Telegraf docs.
No comments yet.