vnStat is a comprehensive package for Linux operating systems used to track and monitor bandwidth usage. It is included in the default repositories of most package managers.
This tutorial will teach you how to install, configure, and view the output from vnStat.
Installing
vnStat has packages in most popular package managers. Use the snippet below relevant for your system, or compile the program from its source code.
Ubuntu/Debian
$ apt-get install vnstatCentOS/Fedora
$ yum install vnstatCompiling from source
Grab the latest version of vnStat from the official site.
$ wget http://humdi.net/vnstat/vnstat-1.14.tar.gzOnce the file has downloaded, extract it and execute the following commands.
$ tar -xvf vnstat-1.13.tar.gz
$ cd vnstat-1.13/
$ make
Once this completes, install it using the command below.
$ make installConfiguration for yum/manual installs
Skip this section if you installed vnStat using apt-get.
If you installed directly from source or using yum, you will have to specify the adapter(s) that you want monitored. This is all configured automatically when installed using apt-get.
Run the following command to view all available interfaces that vnStat can monitor.
$ vnstat --iflistTo log traffic for the default interface on yum/manual installations, execute the following command. This also creates the database for the adapter.
$ vnstat -u -i eth0Next, start the vnStat daemon using the command:
$ vnstatd -d You can also add this command to your /etc/rc.local file, so that it starts automatically when your system boots.
Configuring vnStat options
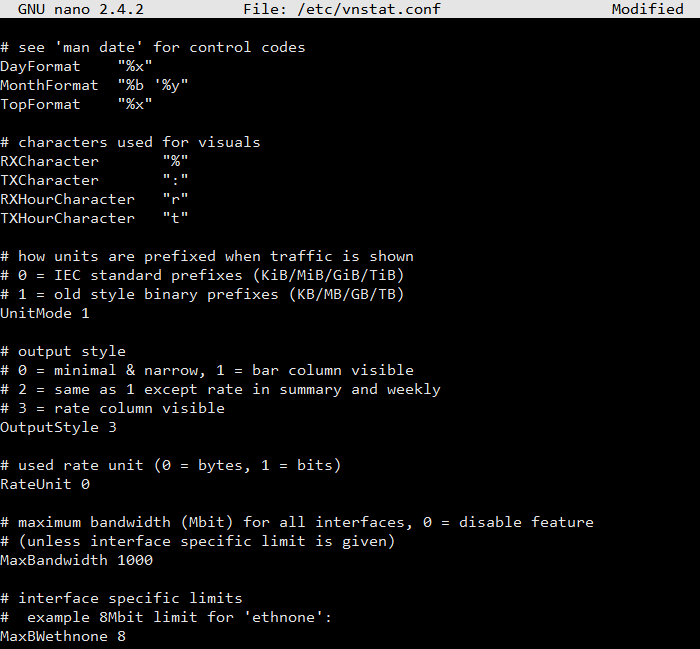
You can edit the vnStat config file located at /etc/vnstat.conf to customize the options to your preference. Use a text editor to open and edit the file.
$ nano /etc/vnstat.confIf you prefer bandwidth stats to be output in KB/MB/GB/TB format instead of the default KiB/MiB/GiB/TiB format, change UnitMode 0 to UnitMode 1, and you may also change RateUnit 1 to RateUnit 0 to display the rates in bytes.
You should also change the maximum bandwidth to that of the port on your VPS (1 GiB or 10 GiB). Change MaxBandwidth 100 to MaxBandwidth 1000 (for 1GiB port) or MaxBandwidth 10000 (for 10GiB port)

Save and exit the file.
Usage
To see a quick summary of the traffic consumed, use the bare command vnstat.
root@vultr:~# vnstat
Database updated: Sun Dec 13 04:56:02 2015

   eth0 since 12/13/2015

          rx:  225 KB      tx:  229 KB      total:  454 KB

   monthly
                     rx      |     tx      |    total    |   avg. rate
     ------------------------+-------------+-------------+---------------
       Dec '15        225 KB |      229 KB |      454 KB |      0.00 KB/s
     ------------------------+-------------+-------------+---------------
     estimated        --     |      --     |      --     |

   daily
                     rx      |     tx      |    total    |   avg. rate
     ------------------------+-------------+-------------+---------------
         today        225 KB |      229 KB |      454 KB |      0.03 KB/s
     ------------------------+-------------+-------------+---------------
     estimated        --     |      --     |      --     |
To get more specific data, you can use the vnstat -m and vnstat -d commands for month and day level output, respectively.
root@vultr:~# vnstat -m

 eth0  /  monthly

       month        rx      |     tx      |    total    |   avg. rate
    ------------------------+-------------+-------------+---------------
      Dec '15        225 KB |      229 KB |      454 KB |      0.00 KB/s
    ------------------------+-------------+-------------+---------------
    estimated        --     |      --     |      --     |

root@vultr:~# vnstat -d

 eth0  /  daily

         day         rx      |     tx      |    total    |   avg. rate
     ------------------------+-------------+-------------+---------------
     12/13/2015       225 KB |      229 KB |      454 KB |      0.03 KB/s
     ------------------------+-------------+-------------+---------------
     estimated        --     |      --     |      --     |
You can also display live traffic statistics using the command vnstat -l.
root@vultr:~# vnstat -l
Monitoring eth0...    (press CTRL-C to stop)

   rx:       0.03 KB/s     0 p/s          tx:       0.19 KB/s     0 p/s
No comments yet.