How to Deploy Apache Kafka as an AWS Kinesis Data Firehose Alternative
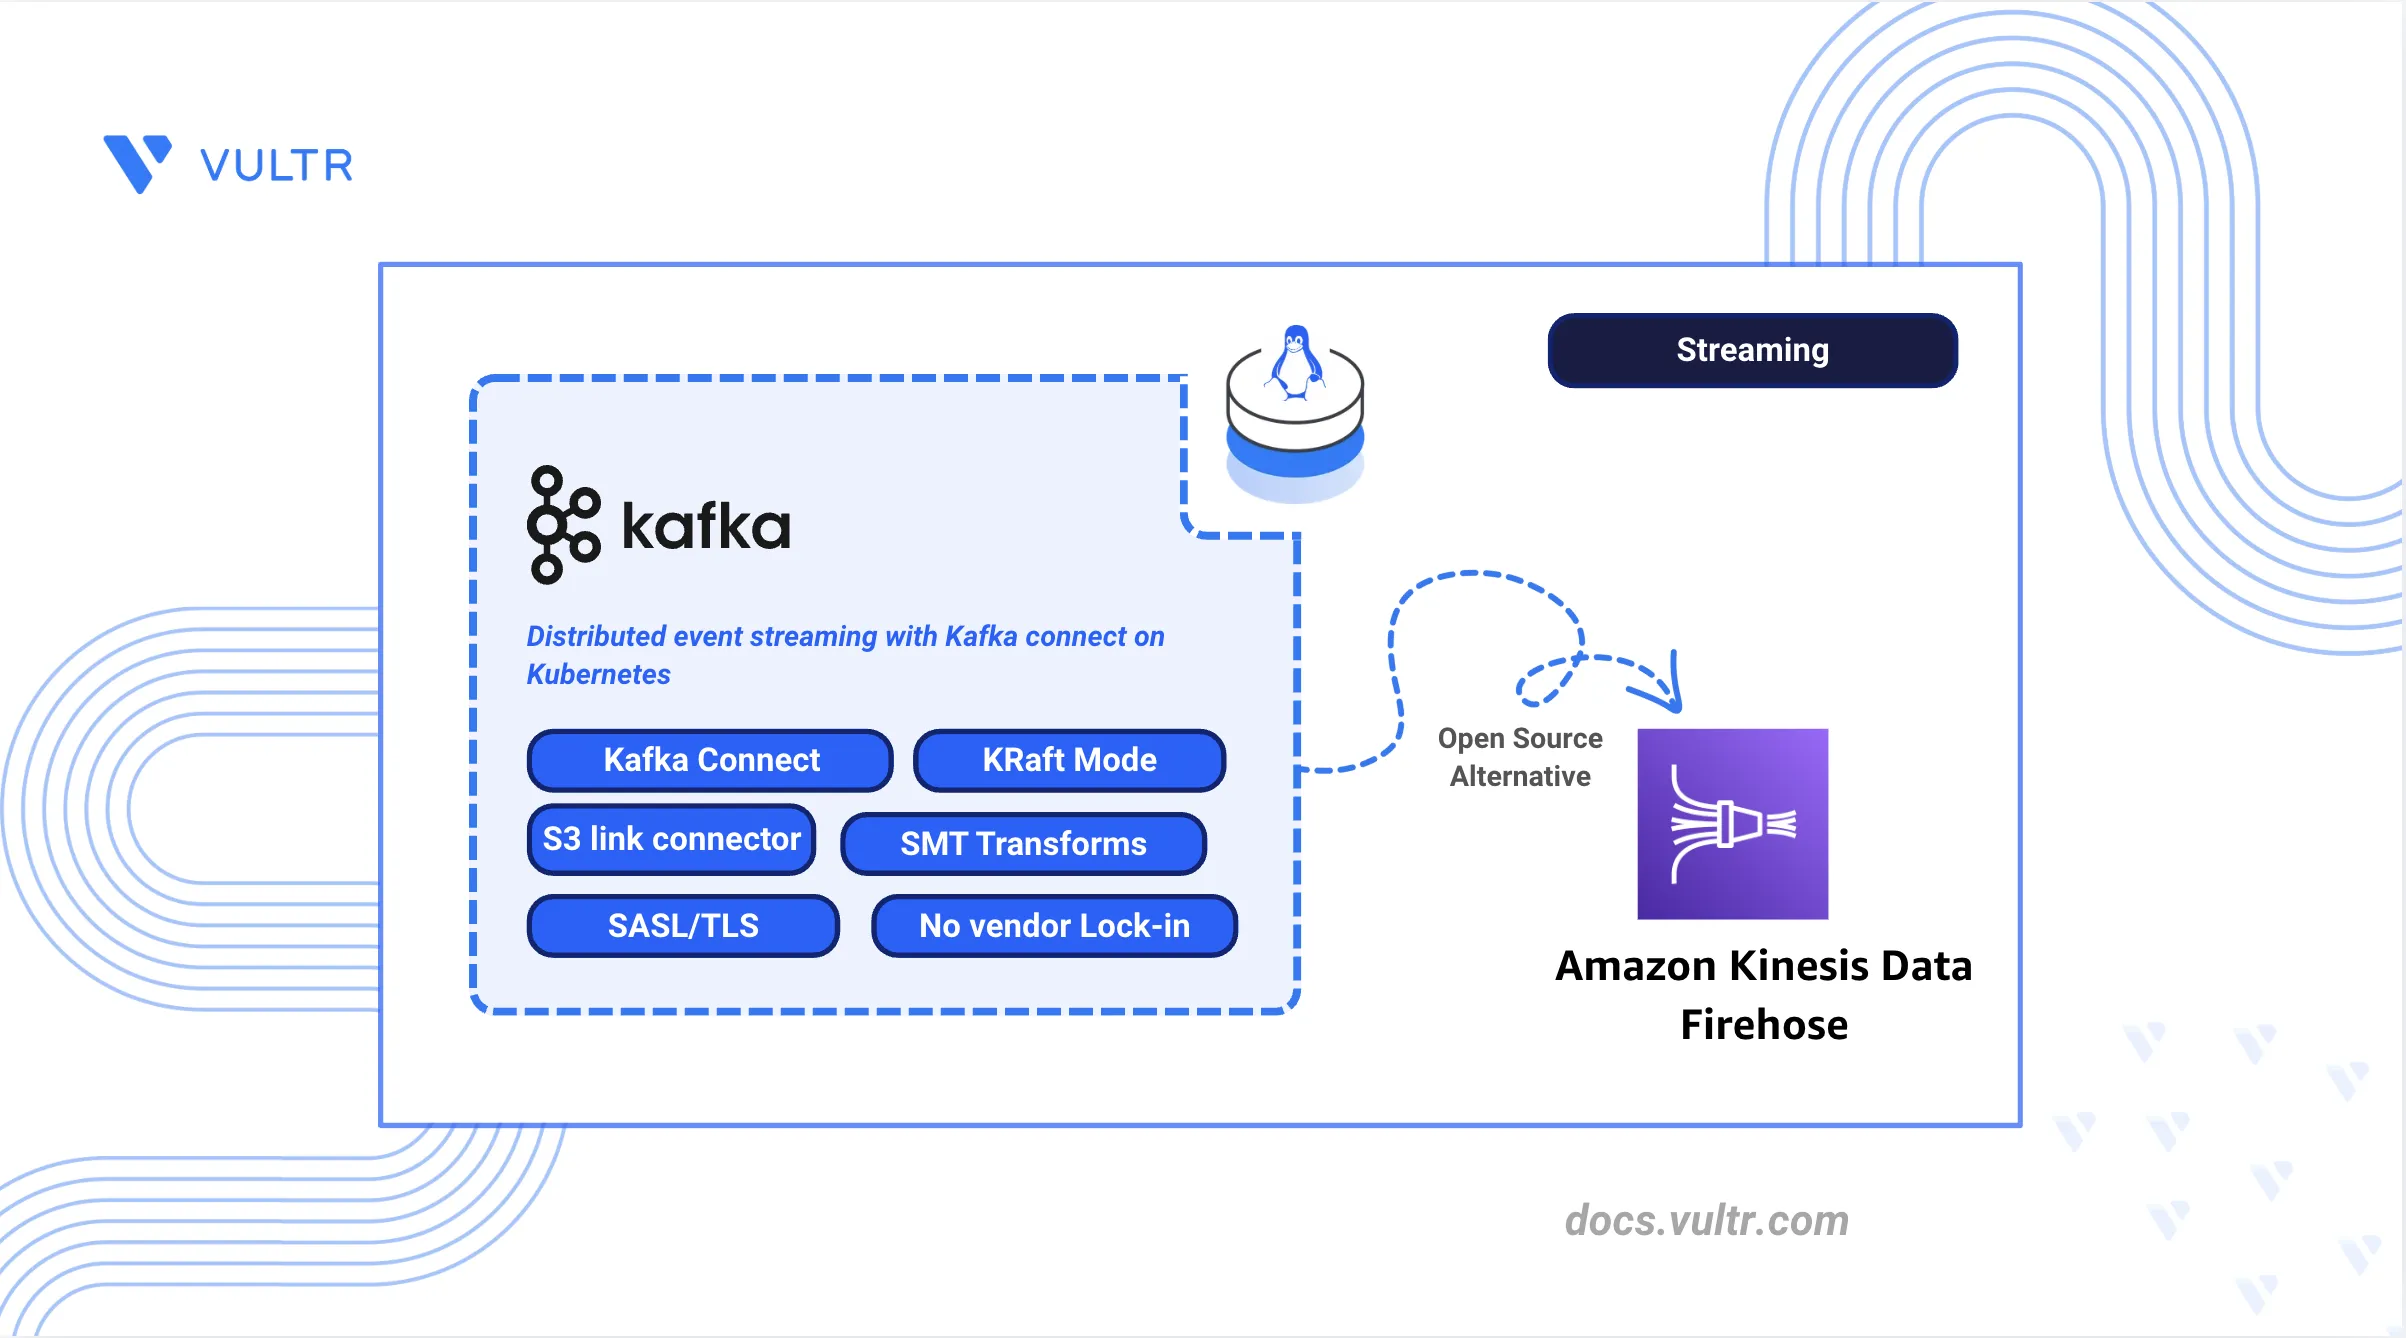
Amazon Data Firehose, formerly known as Amazon Kinesis Data Firehose, is a managed service that loads streaming data into destinations such as Amazon S3, Amazon Redshift, Amazon OpenSearch Service, and Splunk with built-in transformations and auto-scaling. It removes the operational burden of running streaming infrastructure, but it ties delivery pipelines to AWS-specific IAM authentication, per-GB ingestion and delivery pricing, and a fixed set of supported destinations and transform mechanisms.
Apache Kafka is a distributed event streaming platform that handles high-throughput, fault-tolerant messaging with persistent storage and replay capabilities. Combined with Kafka Connect, it provides a connector framework for reliably moving data between Kafka and external systems. Strimzi is a Kubernetes operator that automates deploying, managing, and scaling Kafka clusters through Custom Resource Definitions (CRDs), providing a self-hosted alternative to Amazon Data Firehose with infrastructure-based costs and support for custom destinations and transforms.
This article explains how to deploy Apache Kafka with Strimzi on Kubernetes as an alternative to Amazon Data Firehose. It covers installing the Strimzi operator, deploying a Kafka cluster in KRaft mode, and configuring Kafka Connect with sink connectors for Object Storage. It also covers stream transformations with Single Message Transforms (SMTs), authentication and encryption, monitoring with Prometheus and Grafana, and migration from Amazon Data Firehose.
Understanding Kafka and Kafka Connect Architecture
Apache Kafka and Kafka Connect map directly to Amazon Data Firehose components, providing equivalent functionality through a self-hosted Kafka and Kafka Connect deployment.
The Kafka with Strimzi architecture consists of:
- Kafka Brokers: Distributed servers that store and replicate topic partitions. Strimzi deploys brokers as StrimziPodSets with persistent volumes, using PodSets for more flexible per-pod management.
- KRaft mode: Kafka's built-in consensus protocol replacing ZooKeeper for metadata management, simplifying operations and reducing component count.
- Kafka Connect: Framework for running source and sink connectors that move data between Kafka and external systems.
- Strimzi Operator: Kubernetes operator that manages Kafka, KafkaConnect, KafkaTopic, and KafkaUser resources through declarative CRDs.
- Schema Registry: Optional component for managing Avro, JSON Schema, and Protobuf schemas when using structured data formats.
Prerequisites
Before you begin, you need to:
- Deploy a Kubernetes cluster with at least 3 worker nodes and enough memory to run Kafka, Kafka Connect, Prometheus, and Grafana concurrently (8 GB RAM per node recommended).
- Install and configure kubectl with cluster access.
- Install Helm 3.
- Provision an Object Storage subscription with an S3-compatible API and create a bucket for the connector to write to.
- Provision a container registry to host the custom Kafka Connect image.
Install the Strimzi Kafka Operator
The Strimzi operator watches for Kafka-related Custom Resources and manages the underlying Kubernetes resources (StrimziPodSets, Services, ConfigMaps) automatically.
Add the Strimzi Helm repository.
CONSOLEUpdate the Helm repository cache.
CONSOLECreate a dedicated namespace for Kafka resources.
CONSOLEInstall the Strimzi Kafka operator. The
--versionflag pins the operator to a release whose CRDs still serve thekafka.strimzi.io/v1beta2API used throughout this article. Starting with Strimzi 1.0.0, Strimzi supports only thev1CRD API, so manifests that usev1beta2are not compatible with Strimzi 1.0.0 or newer.CONSOLEVerify that the operator pod is running.
CONSOLEThe output displays a pod named
strimzi-cluster-operator-*with statusRunning.Verify that the CRDs are installed.
CONSOLEThe output lists CRDs including
kafkas.kafka.strimzi.io,kafkanodepools.kafka.strimzi.io,kafkatopics.kafka.strimzi.io,kafkaconnects.kafka.strimzi.io, andkafkausers.kafka.strimzi.io.
Deploy Kafka Cluster
In KRaft mode (Kafka Raft), Kafka manages its own metadata quorum and no longer depends on ZooKeeper. Strimzi models this with KafkaNodePool resources that define groups of nodes acting as brokers, controllers, or both.
Create the KafkaNodePool manifest for the controller and broker nodes.
CONSOLEAdd the following configuration.
YAMLSave and close the file.
In this configuration:
controllerpool: Three nodes that participate in the KRaft quorum for metadata management.brokerpool: Three nodes that store topic partitions and serve client traffic.roles: Defines whether each node acts as a controller, broker, or both. Separating roles is recommended for production.storage.type: persistent-claim: Uses Persistent Volume Claims for data durability across pod restarts. The sizes above (40 GB for controllers, 50 GB for brokers) meet common block storage minimum volume sizes. Increase the broker volumes to match your topic retention and partition footprint.
Apply the KafkaNodePool manifest.
CONSOLECreate the Kafka cluster manifest.
CONSOLEAdd the following configuration.
YAMLSave and close the file.
In this configuration:
strimzi.io/node-pools: enabled: Enables theKafkaNodePoolresources defined in the previous step.strimzi.io/kraft: enabled: Activates KRaft mode, removing the ZooKeeper dependency.metadataVersion: Sets the KRaft metadata version compatible with the configured Kafka version.listeners: Configures both plaintext (port 9092) and Transport Layer Security (TLS) encrypted (port 9093) internal listeners.min.insync.replicas: 2: Requires at least two replicas to acknowledge writes for durability.entityOperator: Deploys the Topic and User operators for managing KafkaTopic and KafkaUser resources.
Apply the Kafka cluster manifest.
CONSOLEMonitor the cluster deployment progress.
CONSOLEWait until the
READYcolumn showsTrue. This may take several minutes as Strimzi provisions the StrimziPodSets and waits for all pods to become ready.Verify that all Kafka pods are running.
CONSOLEThe output displays three controller pods, three broker pods, and entity operator pods, all with status
Running.
Create Ingestion Topics
Kafka topics are the primary mechanism for organizing and storing messages. Sink connectors consume from these topics, so the topics must exist before the connectors are configured.
Create the KafkaTopic manifest for the main data ingestion topic.
CONSOLEAdd the following configuration.
YAMLSave and close the file.
In this configuration:
partitions: 12: Creates 12 partitions for parallel processing. Choose a partition count based on expected throughput and consumer parallelism.replicas: 3: Replicates each partition across all three brokers for fault tolerance.retention.ms: 604800000: Retains messages for 7 days (604800000 milliseconds).cleanup.policy: delete: Removes messages after the retention period expires.segment.bytes: 1073741824: Sets segment file size to 1 GB for efficient disk I/O.
Apply the topic manifest.
CONSOLECreate additional topics for different data streams.
CONSOLEAdd the following configuration.
YAMLSave and close the file.
Apply the additional topics.
CONSOLEVerify that all topics are created.
CONSOLEThe output lists the
events,logs, andmetricstopics with their partition and replica counts.
Deploy Kafka Connect
Kafka Connect provides a framework for running connectors that stream data between Kafka and external systems. Strimzi builds a custom Connect image with the S3 sink connector plugin and runs it as a KafkaConnect resource.
Create a Kubernetes Secret that holds your container registry credentials. Strimzi uses this Secret to push the custom Connect image, and the cluster's worker nodes use it to pull the image. Replace
REGISTRY-HOSTNAME,REGISTRY-USERNAME, andREGISTRY-PASSWORDwith values from your container registry (for example, the hostname, username, and API key from the Overview tab). SetREGISTRY-HOSTNAMEto the registry host only, such asams.vultrcr.com, without thehttps://scheme and without the registry name path. The registry name belongs in the image path in a later step, not in the server value.CONSOLECreate the KafkaConnect manifest with the S3 sink connector plugin.
CONSOLEAdd the following configuration, replacing
REGISTRY-HOSTNAMEwith your registry hostname andREGISTRY-NAMESPACEwith your registry namespace or project path.YAMLSave and close the file.
In this configuration:
annotations.strimzi.io/use-connector-resources: Enables managing connectors via KafkaConnector CRDs instead of the REST API.replicas: 2: Deploys two Connect workers for high availability and load distribution.bootstrapServers: Points to the Kafka cluster's internal bootstrap service.offset.storage.topic,config.storage.topic,status.storage.topic: Internal topics for storing connector state.template.pod.imagePullSecrets: Lets the worker pods pull the built image from the private container registry.build: Builds a custom Connect image with the S3 sink connector plugin using Strimzi's build capability and pushes it to the configured container registry.
Apply the KafkaConnect manifest.
CONSOLEMonitor the build and deployment progress.
CONSOLEWait until the
READYcolumn showsTrue. The initial build may take several minutes.Verify that the Connect worker pods are running.
CONSOLEThe output displays two Connect worker pods with status
Running.Check the available connector plugins.
CONSOLEThe output includes
io.confluent.connect.s3.S3SinkConnectorconfirming the S3 plugin is installed.
Configure S3-Compatible Sink Connector
A sink connector delivers Kafka messages to S3-compatible object storage. Storing credentials in a Kubernetes Secret and non-sensitive settings (bucket name, region, endpoint) in a ConfigMap keeps the connector manifests free of environment-specific values.
Create a Kubernetes Secret with object storage credentials. Replace
OBJECT-STORAGE-ACCESS-KEYandOBJECT-STORAGE-SECRET-KEYwith your S3-compatible access credentials.CONSOLECreate a Kubernetes ConfigMap with the bucket and endpoint settings. Replace
OBJECT-STORAGE-BUCKET,OBJECT-STORAGE-REGION, andOBJECT-STORAGE-ENDPOINTwith values from your object storage provider. SetOBJECT-STORAGE-ENDPOINTto the hostname only (withouthttps://).CONSOLEUpdate the KafkaConnect resource to expose the Secret and ConfigMap values as environment variables on the Connect worker pods.
CONSOLEAdd the following
connectContainerblock under the existingspec.templateblock, at the same indentation as thepodblock already present there.YAMLSave and close the file.
The Strimzi operator injects each value as an environment variable into the Connect worker container. Connector configurations reference these variables using the
${strimzienv:VAR_NAME}substitution syntax, which Strimzi auto-registers via theEnvVarConfigProvideron every Connect worker.Apply the updated KafkaConnect configuration.
CONSOLEWait for the Connect cluster to roll the worker pods.
CONSOLECreate the S3 sink connector manifest.
CONSOLEAdd the following configuration.
YAMLSave and close the file.
In this configuration:
tasksMax: 3: Creates three connector tasks for parallel processing across topic partitions.s3.bucket.name,s3.region,store.url: Resolved at runtime from theS3_BUCKET,S3_REGION, andS3_ENDPOINTenvironment variables sourced from thes3-configConfigMap.aws.access.key.id,aws.secret.access.key: Resolved at runtime from theAWS_ACCESS_KEY_IDandAWS_SECRET_ACCESS_KEYenvironment variables sourced from thes3-credentialsSecret.format.class: Writes records as JSON files. Alternatives includeAvroFormatandParquetFormat.partitioner.class: TimeBasedPartitioner: Organizes files by time-based directory structure.path.format: Creates directories likeyear=2024/month=06/day=15/hour=14.flush.size: 1000: Writes a file after receiving 1000 records.rotate.interval.ms: 600000: Forces file rotation every 10 minutes regardless of record count.
Apply the S3 sink connector.
CONSOLEVerify that the connector is running.
CONSOLEThe output shows the
s3-sink-eventsconnector withREADYstatusTrue.Check the connector status for any errors.
CONSOLE
Configure Additional Sink Connectors
Configure additional connectors to deliver data to multiple destinations from the same Kafka topics, similar to Amazon Data Firehose's multi-destination capability. Each collapsible below is optional and requires a backing service deployed in the cluster before you configure the connector.
Set Up Stream Transformations
Single Message Transforms (SMTs) modify records as they flow through Kafka Connect, providing functionality similar to Amazon Data Firehose Lambda transforms.
Create a connector with SMTs for data enrichment.
CONSOLEAdd the following configuration with transformation chains.
YAMLSave and close the file.
The configuration applies a chain of four transforms to every record:
addTimestamp: Inserts aprocessed_atfield with the time the connector handled the record.addSource: Inserts a staticsourcefield set tokafka-connectfor downstream lineage.filterNull: Drops records that match theisNullValuepredicate, which usesRecordIsTombstoneto identify Kafka tombstone records.maskSensitive: Replaces the values of theemailandssnfields with[REDACTED]to prevent personally identifiable information from reaching the sink.
Apply the transformed sink connector.
CONSOLE
Configure Buffering and Batching
Tune connector flush intervals and batch sizes to balance latency versus throughput, similar to Amazon Data Firehose buffering configuration.
Create a connector with optimized batching for high-throughput scenarios.
CONSOLEAdd the following configuration.
YAMLSave and close the file.
In this configuration:
flush.size: 10000: Writes a file after receiving 10,000 records.rotate.interval.ms: 900000: Forces file rotation every 15 minutes.rotate.schedule.interval.ms: 3600000: Schedules rotation at hourly boundaries.s3.part.size: 26214400: Uses 25 MB parts for multipart uploads.errors.deadletterqueue.topic.name: Routes failed records to a dead-letter queue topic for later analysis.
Apply the batched sink connector.
CONSOLECreate the dead-letter queue topic.
CONSOLEAdd the following configuration.
YAMLSave and close the file.
Apply the dead-letter queue topic.
CONSOLE
Set Up Authentication and Encryption
Configure Simple Authentication and Security Layer (SASL) authentication with the Salted Challenge Response Authentication Mechanism (SCRAM) and TLS encryption to secure Kafka communication, replacing Amazon Data Firehose's IAM-based security model. Enable the authorizer on the Kafka cluster first so that KafkaUser Access Control List (ACL) rules are accepted by the operator.
Update the Kafka cluster to add a TLS-protected SASL listener and enable simple authorization.
CONSOLEAdd an
authorizationblock underspec.kafka, at the same indentation as the existinglistenersandconfigkeys.YAMLAdd the following
sasllistener entry to the existingspec.kafka.listenerslist, below thetlsentry.YAMLSave and close the file.
In this configuration:
authorization.type: simple: Enables Kafka's built-in ACL authorizer. Without this block, the User Operator rejects anyKafkaUserthat declares ACL rules.sasllistener: Adds a TLS-encrypted listener on port 9094 that authenticates clients with SCRAM-SHA-512 credentials.
Apply the updated Kafka cluster configuration and wait for the rolling update to finish.
CONSOLECONSOLECreate the KafkaUser manifest.
CONSOLEAdd the following configuration.
YAMLSave and close the file.
The
connect-prefix ACLs on topics and consumer groups let each sink connector create its internal offset topic and join a dedicated consumer group named after the connector (for example,connect-s3-sink-events).Apply the KafkaUser.
CONSOLEVerify that the user is
Readyand that a credentials Secret was generated.CONSOLEThe output shows
Trueunder theREADYcolumn after the User Operator has reconciled.Note
To connect a client that runs outside the cluster, retrieve the plaintext SCRAM password from the generated Secret with
kubectl get secret connect-user -n kafka -o jsonpath='{.data.password}' | base64 -d. In-cluster components such as KafkaConnect read the password directly from the Secret, so this value is not needed elsewhere in this guide.Update KafkaConnect to use SASL authentication.
CONSOLEChange the existing
spec.bootstrapServersvalue from port9092to the SASL listener on port9094.YAMLAdd the following
tlsandauthenticationblocks underspec, at the same indentation asbootstrapServers.YAMLSave and close the file.
Apply the updated KafkaConnect configuration and wait for the worker pods to roll onto the new SASL/TLS configuration.
CONSOLECONSOLENote
The first worker pod to restart under the new configuration can briefly crash loop with
NoSuchFileException: /tmp/kafka/cluster.truststore.p12, because the mounted CA certificate Secret volume is not always fully populated before the container's truststore-generation step runs on the first attempt. The pod recovers automatically on a subsequent restart within about a minute. If thekubectl waitcommand above times out, checkkubectl get pods -n kafka -l strimzi.io/cluster=kafka-connectbefore troubleshooting further. The pods are often alreadyRunningby then.
Configure Monitoring
Prometheus scrapes the Kafka metrics that Strimzi's JMX exporters expose, and Grafana visualizes them, replacing CloudWatch monitoring.
Enable Strimzi metrics exporters in the Kafka cluster.
CONSOLEAdd the
metricsConfigsection underspec.kafka:YAMLSave and close the file.
Create the metrics configuration ConfigMap.
CONSOLEAdd the following configuration.
YAMLSave and close the file.
Apply the metrics ConfigMap.
CONSOLEApply the updated Kafka cluster configuration.
CONSOLEStrimzi now exposes Prometheus metrics on port
9404of each broker and controller pod. The next steps deploy the Prometheus Operator and create aPodMonitorthat scrapes those endpoints directly, because the pods expose this port but the Kafka Services do not. ThePodMonitorresource depends on themonitoring.coreos.com/v1Custom Resource Definition that the Prometheus Operator installs.Add the Prometheus Community Helm repository.
CONSOLEUpdate the Helm repository cache.
CONSOLEInstall the kube-prometheus-stack.
CONSOLEThe
podMonitorSelectorNilUsesHelmValues=falsesetting allows Prometheus to discoverPodMonitorresources outside the Helm release, including the KafkaPodMonitoryou create in the next steps.Wait for the Prometheus and Grafana pods to become ready.
CONSOLECONSOLEIf Grafana remains in
ErrororCrashLoopBackOff, inspect the pod withkubectl describe pod -l app.kubernetes.io/name=grafana -n monitoringand increase memory limits or add a node with more capacity.Create the PodMonitor manifest that tells Prometheus to scrape Kafka metrics. A PodMonitor is required instead of a ServiceMonitor because Strimzi exposes the
tcp-prometheusmetrics port directly on the broker and controller pods. The headless*-kafka-brokersService it generates does not include that port.CONSOLEAdd the following configuration.
YAMLSave and close the file.
The
matchExpressionsselector matches pods from any Kafka, KafkaConnect, or KafkaMirrorMaker2 resource in the namespace. This PodMonitor can also scrape KafkaConnect worker pods after you enablemetricsConfigon the KafkaConnect resource, following the same pattern shown above for the Kafka cluster.Apply the PodMonitor.
CONSOLEVerify that Prometheus discovered the Kafka scrape targets.
CONSOLEPort-forward the Prometheus UI and open Status, followed by Targets, to confirm
kafka-resources-metricsendpoints appear as UP.CONSOLEOpen
http://localhost:9090/targetsin a web browser.Access Grafana using port-forwarding.
CONSOLEOpen
http://localhost:3000in a web browser and log in with usernameadminand passwordadmin.Open Connections, then Data sources in the left-side menu, and confirm that a Prometheus data source is listed. The kube-prometheus-stack chart provisions it automatically through a Grafana sidecar, but this step can fail silently. If a Prometheus data source already appears, continue to the next step.
If no Prometheus data source is present, click Add new data source and select Prometheus. Set the Prometheus server URL to the in-cluster Prometheus service, then scroll to the bottom and click Save & test. Verify that Grafana reports the data source is working.
Download a Strimzi dashboard definition. This example downloads the Kafka broker dashboard. The grafana-dashboards folder also includes
strimzi-kafka-connect.jsonfor Kafka Connect metrics.CONSOLEIn Grafana, click the + icon in the top-right corner and select Import dashboard. Under Upload dashboard JSON file, drag in or browse to the downloaded
strimzi-kafka.json, or paste its contents into the Import via dashboard JSON model field. Click Load.In the import screen, set the Prometheus data source selector to the Prometheus data source you verified earlier, then click Import.
The dashboard populates after Prometheus has scraped the
kafka-resources-metricstargets.
Verify the Deployment
Validate the complete deployment by testing end-to-end data flow from a producer through Kafka to the S3 sink. The Kafka cluster now requires SASL/SCRAM authentication over TLS, so the test client uses the connect-user credentials and the cluster CA certificate.
Verify that the connector and all its tasks are running.
CONSOLEThe
READYcolumn showsTrue. If any task reportsFAILED, inspect the trace withkubectl exec -n kafka kafka-connect-connect-0 -- curl -s localhost:8083/connectors/s3-sink-events/status.Create a client pod manifest that mounts the cluster CA certificate and exposes the SCRAM password as an environment variable.
CONSOLEAdd the following configuration.
YAMLSave and close the file.
Apply the client pod manifest and wait for it to become ready.
CONSOLECONSOLEGenerate the client properties file inside the pod with the SASL credentials and the cluster truststore path. Use
/bin/bash -lcso the pod'sPASSWORDenvironment variable expands inside the container rather than in your local shell.CONSOLEProduce a batch of 1500 test messages with the same key so they land on one topic partition and cross the connector's
flush.sizethreshold. Files materialize in the bucket within seconds rather than waiting onrotate.interval.ms.CONSOLEWait about 30 seconds for the connector to commit the batch.
List the objects in the bucket. Replace
OBJECT-STORAGE-ACCESS-KEY,OBJECT-STORAGE-SECRET-KEY,OBJECT-STORAGE-REGION,OBJECT-STORAGE-ENDPOINT, andOBJECT-STORAGE-BUCKETwith the values from yours3-credentialsSecret ands3-configConfigMap.CONSOLEThis command runs the AWS CLI in a temporary pod, so no local installation is required. The output displays JSON files organized by the time-based partitioning structure, for example
kafka-events/events/year=2026/month=06/day=25/hour=17/events+0+0000000000.json.Warning
This command passes the Object Storage secret key on the command line, so it is recorded in the pod's container logs. The
--rmflag deletes the pod immediately after the command exits, but rotate the key afterward if the cluster is not disposable, or browse the bucket in the Vultr Console instead to avoid exposing the credentials.Verify the data format by downloading and inspecting one of the listed files. Replace the placeholders as before, and replace the object key with one from the previous listing. This command carries the same credential-exposure risk described in the previous step.
CONSOLEEach line is a JSON record matching the messages produced earlier.
Verify topic delivery by consuming directly from Kafka. Pass
--group verify-groupso the consumer joins the group authorized in theconnect-userACLs.CONSOLEThe output displays the messages produced earlier.
Delete the client pod after verification completes.
CONSOLE
Migrate from Amazon Data Firehose to Kafka Connect
Migrating from Amazon Data Firehose to Kafka Connect involves mapping Firehose streams to topic and connector pairs, updating producer applications, and converting Lambda-based transforms to Kafka Connect SMTs or Kafka Streams. The service was formerly known as Amazon Kinesis Data Firehose. API resources still use names such as DeliveryStreamName. The guidance below assumes you completed Deploy Kafka Cluster, Deploy Kafka Connect, and Set Up Authentication and Encryption earlier in this article.
Firehose Stream Migration
An Amazon Data Firehose stream bundles a source, a destination, and buffering rules into a single managed resource. Kafka Connect splits these responsibilities across two Strimzi resources: a KafkaTopic that holds the records and a KafkaConnector that delivers them to the destination.
- Firehose stream name: Choose a Kafka topic name and a matching
KafkaConnectorname for each Firehose stream. In the Firehose API, this isDeliveryStreamName. - Source: Amazon Data Firehose supports Direct PUT, Amazon Kinesis Data Streams, and Amazon MSK as sources. A Kinesis data stream or MSK cluster backing a Firehose stream maps to a Kafka topic that producers write to directly after migration. Direct PUT streams map to a topic that producer applications write to using the Kafka client instead of the Firehose
PutRecordAPI. - Destination: Common Firehose destination types and their Kafka Connect equivalents:
- Amazon S3: Confluent S3 Sink Connector
- Amazon OpenSearch Service / OpenSearch Serverless: Elasticsearch Sink Connector (requires Elasticsearch 7.x compatibility. See the optional collapsible in Configure Additional Sink Connectors)
- Amazon Redshift: S3 Sink Connector staging to Object Storage, then a separate load step. Firehose delivers to S3 first and runs a Redshift
COPYcommand. It does not write directly to Redshift. Model this with an S3 sink connector and your existing warehouse load tooling rather than the JDBC sink alone. - Splunk: Splunk Sink Connector.
- HTTP endpoints and third-party observability targets (Datadog, New Relic, and similar): HTTP Sink Connector or a custom sink connector
- Buffering: Firehose
BufferingHintsusesIntervalInSeconds(0–900, default 300) andSizeInMBs(1–128 MiB, default 5). If you set one, you must set the other. MapIntervalInSecondsto the connector'srotate.interval.ms(multiply seconds by 1000).SizeInMBsis a byte-size threshold with no direct Kafka Connect equivalent. Approximate it by tuningflush.sizebased on your average record size. Uses3.part.sizefor multipart upload chunk sizing, not as a direct Firehose buffer equivalent.
Producer Migration
Producer changes depend on how data enters Firehose.
If producers use Firehose Direct PUT (the most common pattern), replace the Firehose API with Apache Kafka client libraries:
PutRecord/PutRecordBatch:producer.send()(Amazon Data Firehose usesPutRecordBatch, not Amazon Kinesis Data StreamsPutRecords)DeliveryStreamName: Kafka topic name- Firehose records are opaque data blobs with no partition key. Use a Kafka message key in your producer if you need partition affinity
If producers write to Amazon Kinesis Data Streams that Amazon Data Firehose reads as a source, replace the Kinesis Data Streams API and optionally the Kinesis Producer Library (KPL):
PutRecord/PutRecords:producer.send()StreamName: Kafka topic namePartitionKey: Kafka message key, which Kafka hashes to assign records to partitions- KPL aggregation and batching: Kafka producer
batch.size,linger.ms, andcompression.type
In both cases, update producers to use SASL/SCRAM credentials and the cluster TLS certificate configured in Set Up Authentication and Encryption. Refer to the Kafka producer configuration documentation for tuning options.
Transform Migration
Firehose invokes Lambda transforms synchronously on each buffered batch before delivery. Lambda buffering uses separate hints (BufferSizeInMBs up to 3 MB and IntervalInSeconds up to 900 in the processing configuration), distinct from destination BufferingHints.
Kafka Connect offers two equivalent mechanisms with different operational characteristics:
- Single Message Transforms (SMTs): Suitable for stateless, per-record operations such as field rename, field insertion, format conversion, and filtering with predicates. SMTs run inside the Kafka Connect worker process with no additional infrastructure. Refer to the Confluent SMT reference.
- Kafka Streams: Suitable for stateful operations, windowed aggregations, joins, and complex business logic that exceeds the SMT scope. Kafka Streams applications run as long-lived processes that consume from a source topic, transform records, and produce to a destination topic that the sink connector then reads. Refer to the Kafka Streams documentation.
Unlike Lambda transforms, which scale to zero between invocations, Kafka Streams applications run continuously and consume dedicated compute resources. Account for this cost-model difference when planning capacity.
Destination Configuration Migration
Firehose destination settings such as S3 prefix patterns, file formats, and compression map to Kafka Connect sink connector configuration keys.
- S3 prefix: Firehose
Prefixexpressions such as!{timestamp:yyyy/MM/dd/HH}map to the connector'stopics.dir,partitioner.class, andpath.formatsettings. Refer to the Firehose custom prefix documentation and the S3 Sink Connector partitioning documentation. - Error output prefix: Firehose
ErrorOutputPrefix(for exampleerrors/!{firehose:error-output-type}/!{timestamp:yyyy/MM/dd}) maps to the connector's dead-letter queue topic configured witherrors.deadletterqueue.topic.name. Route that topic to Object Storage with a second sink connector if you require failed records on disk, similar to Firehose writing failed records underErrorOutputPrefix. - Compression: Firehose
CompressionFormatvalues (GZIP,ZIP,Snappy,HADOOP_SNAPPY, orUNCOMPRESSED) map to the connector's format class ands3.compression.typesetting. - File format: Firehose record format conversion from JSON to Parquet or ORC maps to the connector's
format.classsetting combined with a schema-aware converter such as Avro or Protobuf and an AWS Glue schema equivalent in your Kafka ecosystem. - Buffering: Firehose
BufferingHints(IntervalInSeconds,SizeInMBs) map torotate.interval.ms,flush.size, ands3.part.sizeas described under Configure Buffering and Batching.
Data Storage Considerations
For destinations with existing data that needs to be preserved:
- Bucket reuse: Point the S3 sink connector at the same bucket Firehose was writing to, and reserve a new top-level prefix for Kafka Connect output to avoid clashes with existing objects.
- Historical backfill: Replay historical records by reading existing S3 objects with a custom producer script that publishes them back to the source topic, allowing the sink connector to write them under the new prefix structure.
- File format compatibility: Confirm downstream consumers such as data lakes, query engines, and ETL jobs can read the connector's output format. Kafka Connect writes JSON, Avro, or Parquet depending on the configured
format.class. - Partitioning alignment: Match the connector's
path.formatto the existing FirehosePrefixscheme so that downstream queries and data catalogs continue to discover new partitions automatically.
Migration Considerations
Review the following operational differences before cutting production traffic over to the new deployment.
- Auto-scaling: Firehose auto-scales transparently. Kafka Connect requires explicit scaling by adjusting
replicasandtasksMaxon theKafkaConnectresource, or by configuring a Horizontal Pod Autoscaler driven by consumer lag metrics. - Lambda transforms versus Kafka Streams: Firehose Lambda transforms are serverless and billed per invocation. Kafka Streams applications run as always-on workloads, which changes the cost model and the failure surface.
- Monitoring transition: Replace Firehose CloudWatch metrics with the Prometheus metrics and Grafana dashboards configured under Configure Monitoring. Common mappings include
IncomingRecords(ingestion volume),DeliveryToS3.Success(successful S3 deliveries), andBackupToS3.Records(records written to the S3 backup bucket when backup is enabled). - Delivery semantics: Both Firehose and Kafka Connect provide at-least-once delivery by default. Firehose retries failed deliveries and may produce duplicates on producer retries. Implement idempotent writes or deduplication in downstream systems when exactly-once is required.
- Cost model change: Firehose charges per GB of ingested and delivered data. Kafka on Kubernetes costs are infrastructure-based, covering compute, storage, and network. Calculate total cost of ownership including operational overhead before cutover.
- Identity translation: Replace AWS IAM roles and policies with Kubernetes RBAC and
KafkaUserACLs. Map each Firehose IAM role to aKafkaUserwith the minimum set of topic and group ACLs required for its workload. - Throughput limits: Firehose enforces per-stream quotas such as
RecordsPerSecondLimitandBytesPerSecondLimit. Kafka throughput is bounded by your cluster's broker count, partition count, and disk and network capacity.
Conclusion
You have deployed Apache Kafka with Strimzi on Kubernetes as a self-hosted alternative to Amazon Data Firehose. The deployment includes a Kafka cluster, Kafka Connect with S3-compatible sink connectors, stream transformations using SMTs, SASL/SCRAM authentication with TLS encryption, and Prometheus monitoring. For additional configuration options, connector plugins, and advanced features, visit the official Strimzi documentation and Kafka Connect documentation.


0 Comments
Be the first to comment and share your perspective with the community.