
How to Use the Top Command in Linux

Introduction
The top command in Linux displays real-time system information, including running processes, active users, and resource utilization such as CPU and memory. You can use top to monitor, troubleshoot, and identify performance issues in your system.
This article explains how to use the top command in Linux.
The top Command Syntax
The following is the basic syntax of the Linux top command:
top [options]In the above command, options modify the command's behavior to customize the output.
Most Common Linux top Command Options
The following are the most common Linux top command options:
| Option | Description |
|---|---|
-d |
Delays time interval between screen updates. |
-p |
Monitors specific process IDs. |
-n |
Defines the number of iterations before top exits. |
-b |
Runs batch mode operation to capture output in a file. |
-u |
Displays processes for a specific user. |
-s |
Runs top in secure mode to hide or mask certain information. |
-i |
Ignores idle and zombie processes. |
-o |
Sorts processes by a specific field (.or example, CPU usage). |
-H |
Displays individual threads. |
-c |
Shows the command name instead of the command line arguments. This option makes the process list more readable |
Check out how to use the tar command in Linux for quick file archiving and unzipping.
Understand the Linux top Command Interface
The top command interface continuously displays a list of processes and information about CPU usage, memory usage, load averages, and other system statistics by default. The list shows the most resource-intensive processes at the top.
Run the top command without any options to access the default interface to view the system processes, CPU, and memory usage.
$ top
Output:
Press Ctrl or Q to exit the interface.
Sections of a top Command Interface
The top command interface has the following sections:
System Information: Displays general information about the system, including uptime, number of active users, load averages, and number of running processes.
For example:
top - 15:24:15 up 2 days, 4:36, 2 users, load average: 0.08, 0.09, 0.10Task Summary: Displays a summary of the total active tasks including the number of processes and their status.
For example:
Tasks: 142 total, 1 running, 141 sleeping, 0 stopped, 0 zombieSystem Process List: Displays detailed information about each process, including the PID, user, CPU usage, memory usage, and command information.
For example:
PID USER      PR  NI  VIRT  RES  SHR S  %CPU %MEM    TIME+  COMMAND
1234 root      20   0  123M  45M  15M S   0.3  2.5   0:01.23 process_name
Within the above section, each header represents a specific value as described below:
- PID: The unique process ID of each task.
- PR: The system process priority, a lower number represents a higher priority.
- VIRT: Total virtual memory a process uses.
- USER: The system user that owns the running process.
- %CPU: The percentage of CPU a process has consumed.
- SHR: The amount of shared memory a process uses in
KBs(Kilobytes). - NI: The niceness value that prioritizes processes for CPU use. A negative value represents a higher priority, while a positive value represents a lower priority.
- %MEM: Displays the memory a process uses in percentage.
- RES: Displays the amount of resident memory used by the process in
KBs(Kilobytes). - TIME+: Displays the total CPU time a process has used since it started.
- COMMAND: Shows the command that started a process.
CPU Usage: Displays the CPU usage statistics including the time spent on system processes and the average Input/Output (I/O) processing time.
For example:
%Cpu(s): 2.3 us, 1.5 sy, 0.0 ni, 95.6 id, 0.4 wa, 0.0 hi, 0.2 si, 0.0 stIn the above output:
us: Time spent on user processes.sy: Time spent on system (kernel) processes.id: Idle time.wa: Time spent waiting for I/O operations to complete.
Memory Usage: Displays the system's memory usage statistics, including the used and available memory.
For example:
MiB Mem :   8000.0 total,   2048.0 free,   4500.0 used,   1452.0 buff/cache
MiB Swap:   2048.0 total,   2048.0 free,      0.0 used.   3060.0 avail Mem
In the above output:
total: Total available memory.used: Used memory.free: Free memory available for processes.buff/cache: Memory used for buffers and cache.
Run top Command in Linux with Examples
This section uses practical examples to show you how to use the Linux top command. Follow the steps below to run the samples.
Pass the
-cflag to display the process command name instead of arguments making the processes list more readable.console$ top -c
Output:

Set the delay interval between updates in seconds. For example,
5seconds.console$ top -d 5
Output:

Monitor specific process IDs. For example,
1234and5678.console$ top -p 1234,5678
Output:

Run
topwith a specific number of iterations before exiting. For instance,10iterations.console$ top -n 10
Output:

Run the
topcommand in batch mode and forward the interface's output to a file such astop_output.txt.console$ top -b -n 1 > top_output.txt
Output:

Display specific user's processes. Replace
usernamewith the target user.console$ top -u username
Output:

Ignore and hide idle and zombie processes from the
topinterface.console$ top -i
Output:

Sort processes by memory usage in descending order.
console$ top -o %MEM
Output:

Display individual threads.
console$ top -H
Output:

Use the top Command Interactively
Customize the top command interface with the following options to view and manage processes:
| Key | Description |
|---|---|
h |
Display help information about top commands. |
k |
Kill a process using its PID. |
q |
Quit the top interface and return to the command line. |
z |
Toggle color/monochrome mode. |
r |
Renice a process by specifying its PID and new priority value. |
u |
Filter processes by a specific user. |
P |
Sort processes by CPU usage. |
M |
Sort processes by memory usage. |
T |
Sort processes by running time. |
c |
Toggle display of command lines. |
1 |
Toggle display of individual CPU states. |
Use Advanced Linux top Command Options
The Linux top command supports more advanced options to customize the output, as illustrated below:
Run
topin secure mode to hide or mask certain information. For instance, hide the commands for each process.console$ top -s
Output:

Press V within the
topinterface to view processes in a tree structure.
Press Z on your keyboard to modify the display color.

Follow the steps below for additional customizations and color selections.
Press Z to access the color settings page.
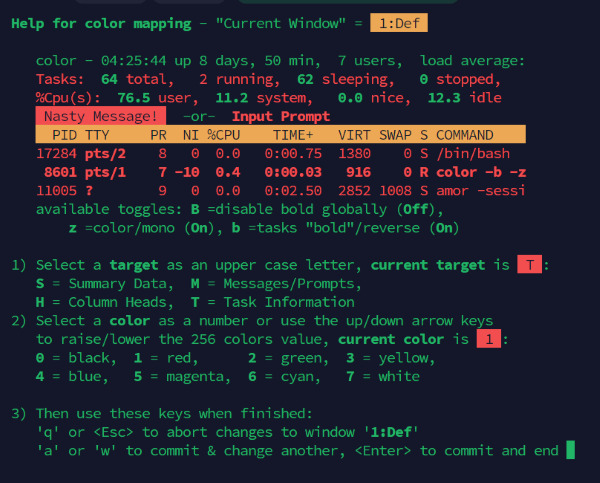
Press any of the following keys to modify the target display field's color:
- S: Summary data area.
- M: Messages and prompts area.
- H: Heading columns.
- T: Information about tasks in the process list.
Select a target color to apply on the display field:
0= black1= red2= green3= yellow4= blue5= magenta6= cyan7= white
Press Enter to confirm your selection and apply changes to your
topinterface.
Use the following keys to customize the
topcommand interface:f: Displays thetopconfiguration screen to toggle columns on or off- Up + Down Navigate through the configurations list.
- Space +
d: Select or deselect columns.

Run the
topcommand and press P to monitor and sort processes by CPU usage.
Run the
topcommand and press M to find memory hogs and sort processes by memory usage.
Run the
topcommand, press K, and enter a signal to kill a process using the PID.
Conclusion
You have used the top command in Linux to monitor system processes. The top command is a powerful tool for monitoring system performance and managing active processes in real time. Use the tool to manage, troubleshoot, and identify performance bottlenecks in your server. For more information, run the man top command.