
10 tools to Monitor Linux Server Resource Usage and Statistics

Introduction
Monitoring Linux Server resources is an important aspect of system administration that lets you track the general server performance and ensure system reliability. To monitor server resources, you can use built-in system utility tools, or install secondary tools to view real-time resource usage and performance statistics.
Linux Server CPU, GPU, memory, and storage devices are some of the major system resources that require constant monitoring. If any important resource fails or performs beyond the allowed capacity, it can directly affect the server performance and lead to system application failures.
This article explains how to monitor Linux Server resource usage and display performance statistics using utility tools to keep track of the general system performance.
Prerequisites
Before you begin:
- Deploy a Vultr Linux server to test the monitoring tools.
- Access the server using SSH as a non-root user with sudo privileges.
- Update the server to install secondary tools.
Monitor Server CPU, GPU, Storage and Memory Usage
NVIDIA-SMI
NVIDIA Management Interface (nvidia-smi) is a cross-platform command line utility that monitors attached GPU devices, VRAM usage,and performance statistics on a GPU-powered Linux Server. By default, nvidia-smi is available as part of the NVIDIA GPU drivers package. You can use the tool to display GPU information in XML or plain test formats.
Run the
nvidia-smicommand to monitor your server GPU usageconsole$ nvidia-smiTo periodically update
nvidia-smito view real-time performance and usage information, use thewatchutility. For example, run the following command to refresh thenvidia-smioutput every5seconds.console$ watch -n 5 nvidia-smi
Press Ctrl + C to stop the watch process.
For more information about the nvidia-smi utility, visit the official documentation.
DF (Disk Free)
Disk Free (DF) is a built-in Linux utility that allows you to monitor the server disk space usage and attached storage device data directories. Using the tool, you can monitor the available file system directories, used space, free space, and mounting locations for each storage device attached to your server.
Run the
dfcommand to view your server disk usage information.console$ dfYour output should look like the one below:
Filesystem 1K-blocks Used Available Use% Mounted on udev 4039772 0 4039772 0% /dev tmpfs 812544 712 811832 1% /run /dev/vda2 176646024 12074588 156985756 8% / tmpfs 4062704 0 4062704 0% /dev/shm tmpfs 5120 0 5120 0% /run/lock /dev/vda1 523244 11848 511396 3% /boot/efi tmpfs 812540 0 812540 0% /run/user/0dfdisplays disk usage in Kilobits. To view data in a human-readable form of Kilobytes, Megabytes, and Gigabytes, use the-hoption.console$ df -h
Output:
Filesystem      Size  Used Avail Use% Mounted on
udev            3.9G     0  3.9G   0% /dev
tmpfs           794M  712K  793M   1% /run
/dev/vda2       169G   12G  150G   8% /
tmpfs           3.9G     0  3.9G   0% /dev/shm
tmpfs           5.0M     0  5.0M   0% /run/lock
/dev/vda1       511M   12M  500M   3% /boot/efi
tmpfs           794M     0  794M   0% /run/user/0
To view information about a specific device volume, specify the filesystem path. For example, view the main system volume
/dev/vda2with the filesystem typeTand human readablehoptions.console$ df -Th /dev/vda1
Output:
Filesystem     Type  Size  Used Avail Use% Mounted on
/dev/vda2      ext4  169G   12G  150G   8% /
The
dfcommand output includes the following sections:- Filesystem: Displays the storage device name on the server filesystem. Usually, the main server storage volume uses the
/dev/vda2virtual disk ID while the boot volume uses/dev/vda1. Additional volumes such as/dev/vda3,/dev/vda4may represent secondary partitions or volumes such as Vultr Block Storage. - 1K-blocks: Displays the volume total size on the file system in 1-kilobyte blocks.
- Type: Displays the volume filesystem format.
- Size: The Total size of the storage volume in Megabytes or Gigabytes.
- Used: Displays the amount of used space on the storage volume.
- Available: Displays the unused space available on the storage volume.
- Use Percentage (Use%): Displays the percentage of used space on the storage volume on a scale of 100%.
- Mounted on: Displays the volume mounting directory on the Linux filesystem. For example,
/represents the root Linux server directory where all system files are stored. Files written to a mount directory are added to the storage volume.
- Filesystem: Displays the storage device name on the server filesystem. Usually, the main server storage volume uses the
For more information and storage monitoring options, view the
dfmanual page.console$ man df
Free
free is a built-in utility that displays information about the server memory usage. It's part of the default procps utilities package and allows you to view available and used memory on the server. This includes the default system memory (RAM) and SWAP memory borrowed from the disk. Run the free command together with your desired memory measurement value to view the active usage statistics.
By default, the
freecommand without any option displays memory usage in Kibibytes.console$ freeYour output should look like the one below:
               total        used        free      shared  buff/cache   available
Mem:         8125412      814608     5234968         724     2395824     7310804
Swap:        8388604           0     8388604
To modify your memory measurement value, use any of the following options:
-b: Bytes-k: Kibibytes-m: Mebibytes-g: Gibibytes--kilo: Kilobytes--mega: Megabytes--giga: Gigabytes
To generate a more readable output, apply the human-readable option
-hto display the server memory usage in Megabytes.console$ free -h
Output:
               total        used        free      shared  buff/cache   available
Mem:            7934         791        5136           0        2319        7143
Swap:           8191           0        8191
Below are the command sections:
- Mem: The main Linux server memory (RAM)
- Swap: Swap memory
- Total: The total memory size
- Used: Displays the amount of used memory
- Free: Displays the amount of free unused memory
- Available: Displays the amount of memory available to run system applications without switching to swap memory.
To monitor the server memory usage in real-time, use the
watchcommand to continuously update the usage statistics. For example, run the following command to update the memory usage statistics every after3seconds.console$ watch -n 3 free -h
To view detailed information about swap memory. Use the
swaponcommand.console$ swaponYour output should look like the one below:
NAME      TYPE SIZE USED PRIO
/swapfile file   8G   0B   -2
For more information, and
freeutility memory usage options, view the command manual page.console$ man free
Top
Top is a built-in command-line utility that displays real-time information about the server resources and processes. It offers a dynamic interface that includes the system information, CPU usage, memory usage, and actively running server processes or threads. Within the top interface, you can monitor and kill any server processes to optimize the system performance.
By default,
topis available in the defaultprocps-ngsystem package. In case of any errors or unavailability, install the package using the default system package manager.Debian/Ubuntu:
console$ sudo apt-get install procps
CentOS/Rocky Linux/ RHEL-based systems
console$ sudo dnf install procps-ng
To use the tool, run the
topcommand.console$ topYour output should look like the one below:
top - 11:45:02 up 1 day, 13:55,  1 user,  load average: 1.93, 1.85, 1.85
Tasks: 129 total,   1 running, 128 sleeping,   0 stopped,   0 zombie
%Cpu(s): 41.9 us,  0.7 sy,  0.0 ni, 57.2 id,  0.0 wa,  0.0 hi,  0.3 si,  0.0 st
MiB Mem :   7935.0 total,   5111.6 free,    812.8 used,   2323.1 buff/cache
MiB Swap:   8192.0 total,   8192.0 free,      0.0 used.   7122.2 avail Mem

    PID USER      PR  NI    VIRT    RES    SHR S  %CPU  %MEM     TIME+ COMMAND

   2731 root      20   0  792044 169828  15124 S 168.7   2.1     64,31 ffmpeg
    911 root      20   0  799768 123128     40 S   4.3   1.5  71:21.02 obs-studio
  33660 nginx     20   0 1269972  64124  31556 S   0.7   0.8   5:08.51 nginx
     21 root      20   0       0      0      0 S   0.3   0.0   0:06.73 ksoftirqd/1
  42893 root      20   0   11612   5524   3360 R   0.3   0.1   0:01.98 top
      1 root      20   0  168792  13532   9268 S   0.0   0.2   0:05.17 systemd
      2 root      20   0       0      0      0 S   0.0   0.0   0:00.03 kthreadd
The
topinterface is divided into the following sections:- System Information: Displays real-time system information with the time, uptime, number of logged in Linux users, and load averages.
- Tasks: Displays the total number of running tasks, active, stopped, and dormant processes on the server.
- CPU Usage: Displays the CPU usage percentages including the time spent on system processes and the average Input/Output (I/O) processing time.
- Memory Usage: Displays the server memory usage statistics including used and available memory.
- System Processes: Displays all running processes available on the server. Within the section, each header represents a specific value as described below:
- PID: The unique process id of each task on the server.
- PR: The system process priority, a lower number represents a higher priority.
- VIRT: Total virtual memory in use by a process.
- USER: The system user that owns the running process.
- %CPU: The percentage of CPU usage occupied by the process.
- SHR: Represents the process Shared Memory size in Kilobytes.
- NI: The process niceness value. A negative value represents a higher process priority while a lower priority uses a positive value.
- %MEM: Displays the memory usage percentage occupied by the process.
- RES: Displays the amount of resident memory used by the process in Kilobytes.
- TIME+: Shows the process CPU execution time.
- COMMAND: The server command under which the process runs.
Press Q to exit the
topinterface.To limit the
topoutput to strictly display processes started by a user, apply the-uoption together with the target username. For example,linuxuser.console$ top -u linuxuser
Output:
top - 22:00:09 up 15 min,  2 users,  load average: 0.00, 0.01, 0.00
Tasks: 125 total,   1 running, 124 sleeping,   0 stopped,   0 zombie
%Cpu(s):  0.0 us,  0.0 sy,  0.0 ni,100.0 id,  0.0 wa,  0.0 hi,  0.0 si,  0.0 st
MiB Mem :    951.5 total,     68.8 free,    205.4 used,    677.3 buff/cache
MiB Swap:   2400.0 total,   2392.2 free,      7.8 used.    596.2 avail Mem


    PID USER          PR  NI    VIRT    RES    SHR S  %CPU  %MEM     TIME+ COMMAND
   3074 linuxuser  20   0    8732   4496   3788 S   0.0   0.5   0:00.02 bash
   4469 linuxuser  20   0   10500   4076   3488 R   0.0   0.4   0:00.01 top
To kill an active process on the server, press
k, enter the Process ID to stop, and press Enter to end the process thread.For more information and command options, view the
topcommand manual page.console$ man top
VmStat
Virtual Memory Statistics (VmStat) is a built-in utility that displays real-time information about the system memory, virtual memory, paging, and CPU activity. It's an important tool that allows you to constantly monitor your Linux server performance, identify memory-related issues, and analyze how running processes utilize the available system resources.
By default VmStat is part of the Linux
procps-ngpackage, to use the tool, run thevmstatcommand.console$ vmstatOutput:
procs -----------memory---------- ---swap-- -----io---- -system-- ------cpu-----
r  b   swpd   free   buff  cache   si   so    bi    bo   in   cs us sy id wa st
0  0  19824  71196  13852 631596    0    6   435  1008   78  207  1  1 98  0  0
Below is what the
vmstatinformation categories represent:- procs: Process information about actively running processes.
- memory: Server memory usage statistics.
- swap: Available Swap memory usage processes.
- io: Input and Output information that includes blocks sent in and out to the server storage devices.
- system: System-related statistics including interrupts and the number of context switches per second.
- cpu: CPU usage statistics with the average processing time in each space.
To update the VmStat output after a specific time, include the time range as a command option. For example, update the output after every
2seconds.console$ vmstat 2
To display a specific number of monitoring reports, include the count interval value as an option. For example, to update the monitoring information every
2seconds and generate only10reports, run the following command.console$ vmstat 2 10
To view a summary of the server memory and CPU usage statistics, use the
-soption.console$ vmstat -s
Output:
   974344 K total memory
   257164 K used memory
   337900 K active memory
   353560 K inactive memory
    71196 K free memory
    14060 K buffer memory
   631924 K swap cache
  2457596 K total swap
    19824 K used swap
  2437772 K free swap
     3618 non-nice user cpu ticks
      407 nice user cpu ticks
     2706 system cpu ticks
   376208 idle cpu ticks
      222 IO-wait cpu ticks
        0 IRQ cpu ticks
       43 softirq cpu ticks
        2 stolen cpu ticks
  1484613 pages paged in
  3451429 pages paged out
      340 pages swapped in
     5331 pages swapped out
   281987 interrupts
   734623 CPU context switches
1697060650 boot time
     6384 forks
To view server disk statistics, use the
-doption.console$ vmstat -d
Output:
disk- ------------reads------------ ------------writes----------- -----IO------
       total merged sectors      ms  total merged sectors      ms    cur    sec
loop0     67      0    2486       8      0      0       0       0      0      0
loop1   1203      0   90584      86      0      0       0       0      0      3
loop2    222      0    4720      17      0      0       0       0      0      0
loop3    635      0   47156      29      0      0       0       0      0      1
loop4     26      0      68       0      0      0       0       0      0      0
loop5      0      0       0       0      0      0       0       0      0      0
loop6      0      0       0       0      0      0       0       0      0      0
loop7      0      0       0       0      0      0       0       0      0      0
vda    29546   6331 2824453    6052  13387  17304 9419714   18500      0     23
sr0        4      0       1       0      0      0       0       0      0      0
To further optimize your VmStat monitoring output, view the command manual page and use any of the following options.
console$ man vmstat
The available options include:
-a: Views the active server memory statistics and displays active and inactive memory pages.-m: Displays information about the server Kernel slab cache memory usage.-n: Shows column headers only once instead of every update interval.-s: Displays a summary of memory usage, CPU and I/O statistics.-d: Displays disk I/O statistics including read and write operations to storage devices.-S: Sets the memory size display units. For example,vmstat -S Mdisplays the memory values in Megabytes.-t: Includes a timestamp on each output line.
Monitor System Processes
PS
Process Status (PS) is a built-in command line utility that displays information about actively running processes on your Linux server. Using the tool, you can view processes started by all users, a specific Linux user, or system daemons. In addition, you can filter the listed information using the grep utility to search for specific processes on the server.
Run the
pscommand to view actively running processes in your terminal session.console$ psOutput:
   PID TTY          TIME CMD
162611 pts/0    00:00:00 bash
166207 pts/0    00:00:00 ps
To view all actively running processes on the server across all terminal sessions, use the
auxoption.console$ ps aux
Output:
root       18112  0.0  0.0   2472    76 ?        S<   Nov20   0:06 /usr/sbin/atopacctd
monitor+   47565  0.0  1.1  82208 11272 ?        Ss   Nov20   0:06 monitorix-httpd listening on 8080
root       69049  0.0  0.4  25260  4816 ?        Ss   Nov21   0:00 /lib/systemd/systemd-udevd
root       69121  0.0  8.6 123048 85028 ?        Ss   Nov21   0:30 /lib/systemd/systemd-journald
root       73301  0.0  0.8  15408  8548 ?        Ss   Nov21   0:15 sshd: /usr/sbin/sshd -D [listener] 0 of 10-100 startups
ntpsec     73560  0.0  1.9  84880 19240 ?        SLs  Nov21   0:07 /usr/sbin/ntpd -p /run/ntpd.pid -c /etc/ntpsec/ntp.conf -g -N -u ntpsec:ntpsec
root      126843  0.0  1.0  11032  9948 ?        S<Ls 00:00   0:02 /usr/bin/atop -w /var/log/atop/atop_20231122 600
www-data  126922  0.0  1.1 753740 10988 ?        Sl   00:00   0:00 /usr/sbin/apache2 -k start
www-data  126923  0.0  0.7 753740  6900 ?        Sl   00:00   0:00 /usr/sbin/apache2 -k start
root      152214  0.0  0.0      0     0 ?        I    09:11   0:06 [kworker/0:1-events]
root      162583  0.0  1.1  17828 11140 ?        Ss   14:21   0:00 sshd: linuxuser [priv]
linuxus+  162586  0.0  1.0  18868 10508 ?        Ss   14:21   0:00 /lib/systemd/systemd --user
To sort the system processes information, use the
--sort=option and include your target value. For example, sort the server processes by memory usage.console$ ps aux --sort=-%mem
Other sorting values include:
-%cpu: Sorts running processes by the CPU usage percentage in descending order. Applying+instead of-sorts the usage values in ascending values.-%mem: Displays running processes based on the memory usage percentage in descending order.+rss: Displays processes based on the real-time memory usage.+start_time: Displays processes based on the start time in ascending order. Old processes first are display first and newer processes last.+user: Sorts the running processes based on the user and process owner values.
To view the processes started by a specific user, apply the
-uoption and the target username.console$ ps -u root
To view the command in full format with additional values such as User ID, process ID, and CPU utilization details, use the
-foption.console$ ps -f
To view more
psprocess monitoring options, view the command manual.console$ man ps
Htop
Htop is an interactive system process viewer that displays real-time information about active server processes, CPU, and memory usage. It's an improved version of the built-in top utility with additional monitoring features and capabilities. To use Htop on your server, install the latest version using the default system package manager.
Install Htop:
Debian/Ubuntu:
console$ sudo apt install htop
CentOS/Rocky Linux/Fedora/RHEL systems
console$ sudo dnf install htop
Verify the installed Htop version.
console$ htop --version
Output:
htop 3.2.2Open the Htop interface to view active server processes.
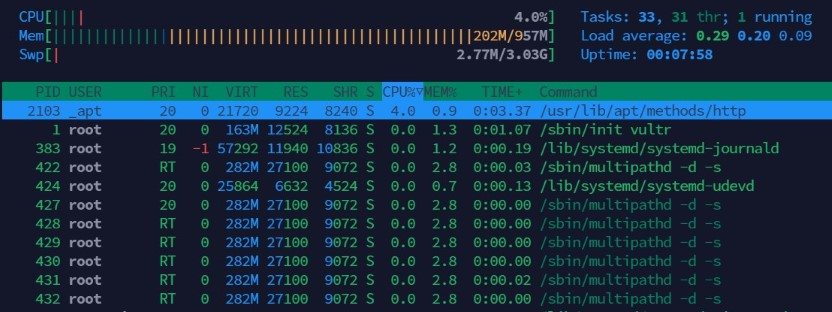
Within the Htop interface, monitor the Process section to view real-time statistics of all actively running server processes. To navigate through the additional features, use a combination of keyboard function key shortcuts and interactive commands listed at the bottom of the interface.
Press
:key_q:to stop monitoring and close the Htop interface.To modify the Htop interface, define an option while starting the command. For example, display processes with a hierarchical tree view.
console$ htop -t
For example:
-t: Displays system processes in a tree view depending on the parent directory to monitor process hierarchies.-C: Start Htop in monochrome mode without any coloring.-d: Sets the processes update interval in seconds. For example,-d 5updates the process information every 5 seconds.-p: Displays information about specific process IDs (PIDs). You can specify one or more PIDs as arguments using this option. For example,-p 623displays statistics for the process ID623.-u: Displays processes owned by a specific user on the Linux server. For example,-u example-userdisplays all active processes started byexample-user.-H: Hides threads and displays only the parent process for multi-threaded applications.
For more information and monitoring options, view the Htop manual page.
console$ man htop
Lsof
List Open Files (LSof) is a built-in tool that displays information about all open files and directories in use by system processes. This allows you to keep track of open directories and server processes that actively use specific files on the server. To use lsof, start the command with sudo privileges to view all processes or monitor specific processes using the respective process ID.
List all open files in use by active processes and the respective process IDs on your server.
console$ sudo lsof
Your output should look like the one below:
COMMAND     PID  TID TASKCMD       USER   FD      TYPE             DEVICE SIZE/OFF       NODE NAME
systemd       1                    root  cwd       DIR              254,2     4096          2 /
systemd       1                    root  rtd       DIR              254,2     4096          2 /
systemd       1                    root  txt       REG              254,2    92544       5001 /usr/lib/systemd/systemd
systemd       1                    root  mem       REG              254,2   157768        440 /usr/lib/x86_64-linux-gnu/libgpg-error.so33.1
systemd       1                    root  mem       REG              254,2   629384        691 /usr/lib/x86_64-linux-gnu/libpcre2-8.so.0.112
systemd       1                    root  mem       REG              254,2   907784         56 /usr/lib/x86_64-linux-gnu/libm.so.6
systemd       1                    root    2u      CHR                1,3      0t0          4 /dev/null
systemd       1                    root    3w      CHR               1,11      0t0         10 /dev/kmsg
systemd       1                    root    4u  a_inode               0,14        0       9609 [eventpoll:5,6,9,11,12,14,15,16,17,18,19,2021,26,31,34,35,49,62,71,72,73,74,75,76,77,85,86]
systemd       1                    root    5u  a_inode               0,14        0       9609 [signalfd]
List open files in use by server processes on a specific directory. For example, view open files in use by system processes on the root system directory
/.console$ sudo lsof /
List all files in use by processes started by a specific user.
console$ sudo lsof -u linuxuser
Output:
COMMAND     PID  TID TASKCMD       USER   FD      TYPE             DEVICE SIZE/OFF       NODE NAME
sshd     1146 linuxuser    5u     unix 0x000000008a363cd1      0t0      16919 type=STREAM (CONNECTED)
sshd     1146 linuxuser    7u      CHR                5,2      0t0         85 /dev/ptmx
sshd     1146 linuxuser    8w     FIFO               0,23      0t0       1092 /run/systemd/sessions/2.ref
bash     1147 linuxuser  cwd       DIR              254,2     4096    1020929 /home/linuxuser
bash     1147 linuxuser  rtd       DIR              254,2     4096          2 /
bash     1147 linuxuser  txt       REG              254,2  1265648       1598 /usr/bin/bash
bash     1147 linuxuser  mem       REG              254,2  1922136         53 /usr/lib/x86_64-linux-gnu/libc.so.6
List all server processes that use a specific network port. For example, view all processes using the HTTP port
80.console$ sudo lsof -i :80
List files in use by a specific program or server application. For example, view all files in use by the Apache web server
console$ sudo lsof /usr/sbin/apache2
To display accurate information, use the main application executable binary file. When successful, your output should look like the one below:
COMMAND   PID     USER  FD   TYPE DEVICE SIZE/OFF  NODE NAME
apache2 14081     root txt    REG  254,2   725920 73333 /usr/sbin/apache2
apache2 14083 www-data txt    REG  254,2   725920 73333 /usr/sbin/apache2
apache2 14084 www-data txt    REG  254,2   725920 73333 /usr/sbin/apache2
To find the binary location of a specific application on your server, use the
whichcommand to view the active path.For more information and command options, view the
lsofmanual page.console$ man lsof
Iotop
iotop is a real-time interactive Input/Output (I/O) process monitoring tool that allows you to view processes or threads actively accessing the server storage devices. It allows you to identify processes that consume the most disk I/O bandwidth and provides insights into how different processes interact with storage devices. Within the output, the read-write speed, time spent on swapping, priority class, command, and the respective process users make it possible to actively track events on the server. To use iotop, install the version using your default system package manager.
Install
iotop:On a Debian or Ubuntu server:
console$ sudo apt install iotop
CentOS/Rock Linux or Fedora Linux
console$ sudo dnf install iotop
Verify the installed
iotopversion$ sudo iotop --versionOutput:
consoleiotop 0.6
Open the
iotopinterface to start monitoring all server processesconsole$ sudo iotop
Output:
Total DISK READ:         0.00 B/s | Total DISK WRITE:         0.00 B/s
Current DISK READ:       0.00 B/s | Current DISK WRITE:       0.00 B/s
    TID  PRIO  USER     DISK READ DISK WRITE>    COMMAND
      1 be/4 root        0.00 B/s    0.00 B/s init vultr
      2 be/4 root        0.00 B/s    0.00 B/s [kthreadd]
      3 be/0 root        0.00 B/s    0.00 B/s [rcu_gp]
      4 be/0 root        0.00 B/s    0.00 B/s [rcu_par_gp]
      5 be/0 root        0.00 B/s    0.00 B/s [slub_flushwq]
      6 be/0 root        0.00 B/s    0.00 B/s [netns]
     10 be/0 root        0.00 B/s    0.00 B/s [mm_percpu_wq]
     11 be/4 root        0.00 B/s    0.00 B/s [rcu_tasks_kthread]
     14 be/4 root        0.00 B/s    0.00 B/s [ksoftirqd/0]
     15 be/4 root        0.00 B/s    0.00 B/s [rcu_preempt]
     16 rt/4 root        0.00 B/s    0.00 B/s [migration/0]
     18 be/4 root        0.00 B/s    0.00 B/s [cpuhp/0]
Within the interface, identify resource-intensive server processes, troubleshoot I/O performance issues, and optimize the server storage usage based on the active processes.
Press Q on your keyboard to close the
iotopinterface.To view active server processes performing I/O operations instead of all system threads, use the
-ooption.console$ sudo iotop -o
To include a timestamp on all server processes, apply the
-toption.console$ sudo iotop -t
To view server processes started by a specific system user, apply the
-uoption. For example, view processes started bylinuxuser.console$ sudo iotop -u linuxuser
Output:
Total DISK READ:         0.00 B/s | Total DISK WRITE:         0.00 B/s
Current DISK READ:       0.00 B/s | Current DISK WRITE:       0.00 B/s
  TID  PRIO  USER     DISK READ DISK WRITE>    COMMAND
 1122 be/4 linuxuse    0.00 B/s    0.00 B/s systemd --user
 1124 be/4 linuxuse    0.00 B/s    0.00 B/s (sd-pam)
 1146 be/4 linuxuse    0.00 B/s    0.00 B/s sshd: linuxuser@pts/0
 1147 be/4 linuxuse    0.00 B/s    0.00 B/s -bash
To further modify your
iotopoutput, implement more options such as:-n: Sets the number of iterations in batch mode beforeiotopexits. For example,-n 5runs only 5 iterations and stops.-a: Shows the number if I/O processes instead of bandwidth.-b: Starts iotop in batch mode with a continuous output necessary for logging or scripting operations.-d: Sets theiotopupdate interval in seconds. For example,-d 2updates the output every 2 seconds.-p: Displays I/O information for a specific process ID. For example-p 1121displays I/O processes started by the Process ID1121.-q: Removes the output header and summary information to display only active processes.
For more information and command options, view the
iotopmanual page.console$ man iotop
Monitor Server Uptime and Kernel Messages
Uptime
Uptime is a basic Linux utility that monitors the server uptime, actively logged-in users, and system load averages. Using the tool, you can keep track of the server boot time, CPU idle time, and the uptime duration since the last reboot. To use the tool, verify the installed version on your system, then, apply fine-tune your output using the available command options.
Verify your system's Uptime utility version.
console$ uptime -V
Output:
uptime from procps-ng 4.0.2View the Server Uptime, logged-in users, and the system load averages.
console$ uptimeOutput:
01:29:57 up 7:32, 1 user, load average: 0.00, 0.02, 0.03View the Server Uptime in hours and minutes.
console$ uptime -p
Output:
up 7 hours, 32 minutesView the last server reboot date.
console$ uptime -s
Output:
2023-11-19 17:57:53
Strace
strace is a Linux diagnostic utility tool that monitors system calls and signals. It runs a specific program or command until it exits to keep track of the system calls made by the process, and the signals received by the process. This allows you to monitor the performance of Kernel state functions while executing a specific command for debugging, and troubleshooting purposes.
Install
straceif it's not available on your server:Debian/Ubuntu:
console$ sudo apt install strace
CentOS/RHEL systems:
console$ sudo dnf install strace
Verify the available
straceversion on your serverconsole$ strace --version
Output:
strace -- version 6.1Using
strace, trace the calls of a specific server application. For example:apache2console$ sudo strace apache2
Your output should look like the one below:
m`map(NULL, 8192, PROT_READ|PROT_WRITE, MAP_PRIVATE|MAP_ANONYMOUS, -1, 0) = 0x7fd3919fa000
mmap(NULL, 8192, PROT_READ|PROT_WRITE, MAP_PRIVATE|MAP_ANONYMOUS, -1, 0) = 0x7fd3919f8000
mmap(NULL, 8192, PROT_READ|PROT_WRITE, MAP_PRIVATE|MAP_ANONYMOUS, -1, 0) = 0x7fd3919f6000
mmap(NULL, 8192, PROT_READ|PROT_WRITE, MAP_PRIVATE|MAP_ANONYMOUS, -1, 0) = 0x7fd3919f4000
mmap(NULL, 8192, PROT_READ|PROT_WRITE, MAP_PRIVATE|MAP_ANONYMOUS, -1, 0) = 0x7fd3919f2000
socket(AF_NETLINK, SOCK_RAW|SOCK_CLOEXEC, NETLINK_ROUTE) = 3
bind(3, {sa_family=AF_NETLINK, nl_pid=0, nl_groups=00000000}, 12) = 0
getsockname(3, {sa_family=AF_NETLINK, nl_pid=18776, nl_groups=00000000}, [12]) = 0
sendto(3, [{nlmsg_len=20, nlmsg_type=RTM_GETADDR, nlmsg_flags=NLM_F_REQUEST|NLM_F_DUMP, nlmsg_seq=1700444885, nlmsg_pid=0}, {ifa_family=AF_UNSPEC, ...}], 20, 0, {sa_family=AF_NETLINK, nl_pid=0, nl_groups=00000000}, 12) = 20
To monitor a specific process on the server, use the
-poption and include the process ID. For example, trace the process ID1121.console$ sudo strace -p 1121
For more information, view the
stracecommand manual page.console$ man strace
Conclusion
You have applied Linux resource monitoring tools to keep track of the server CPU usage, memory usage, system processes, and Kernel messages. To fine-tune your server performance, you should continuously track each tool's output to manage high-resource processes or upgrade necessary resources to meet the server demands. For more information about each tool, view the command manual page to explore the additional usage options.