Benchmark Results Overview
Updated on 11 March, 2026Consolidated benchmark results for all five models on NVIDIA HGX B200 GPUs.
Test Configuration
| Parameter | Value |
|---|---|
| GPUs | 8x NVIDIA HGX B200 (179 GB HBM3e each) |
| Framework | vLLM 0.16.0 (Nemotron, Nemotron Super, GLM-5, DeepSeek) / 0.12.0 (MiniMax) |
| Input tokens | 2,048 |
| Output tokens | 512 |
| Dataset | Random (synthetic) |
| GPU memory utilization | 0.90 |
| Concurrency sweep | 1, 8, 16, 32, 64, 128, 256, 512, 1024 |
Peak Throughput Summary
| Model | Active Params | TP | GPUs | Peak tok/s | tok/s/GPU | Saturation |
|---|---|---|---|---|---|---|
| Nemotron Nano 30B (FP8) | 3B | 2 | 2 | 18,829 | 9,415 | ~512 |
| Nemotron Nano 30B (NVFP4) | 3B | 1 | 1 | 15,575 | 15,575 | ~512 |
| Nemotron Super 49B (FP8) | 49B | 1 | 1 | 3,816 | 3,816 | ~64* |
| MiniMax M2.5 229B | 10B | 4 | 4 | 8,838 | 2,210 | ~512 |
| GLM-5 744B | 40B | 8 | 8 | 2,132 | 267 | ~128 |
| DeepSeek V3.2 685B | 37B | 8 | 8 | 4,370 | 546 | ~512 |
* Nemotron Super 49B exhibits throughput oscillation at c=256 and c=1024 (~1,587 tok/s, roughly half of peak) due to TP=1 batch scheduling effects. Peak throughput is stable at c=64–128 and c=512.
Throughput per Active Parameter
A useful metric for comparing architectural efficiency: how many tokens per second does each active billion parameters produce?
| Model | Active Params | Peak tok/s | tok/s per Active-B |
|---|---|---|---|
| Nemotron Nano 30B (FP8) | 3B | 18,829 | 6,276 |
| Nemotron Nano 30B (NVFP4) | 3B | 15,575 | 5,192 |
| Nemotron Super 49B (FP8) | 49B | 3,816 | 78 |
| MiniMax M2.5 229B | 10B | 8,838 | 884 |
| GLM-5 744B | 40B | 2,132 | 53 |
| DeepSeek V3.2 685B | 37B | 4,370 | 118 |
Nemotron Nano's extreme per-parameter efficiency comes from the Mamba hybrid architecture: SSM layers have no KV cache overhead and process tokens in O(n), keeping the memory bandwidth pipeline saturated. The NVFP4 variant achieves 5,192 tok/s per active-B on a single GPU, making it the most cost-efficient configuration tested.
Latency Summary (at 32 Concurrent)
Concurrency 32 represents a realistic interactive workload: enough load to keep GPUs busy without excessive queuing.
| Model | TTFT (ms) | TPOT (ms) | ITL p99 (ms) |
|---|---|---|---|
| Nemotron Nano 30B (FP8) | 206 | 7.86 | 40.72 |
| Nemotron Nano 30B (NVFP4) | 280 | 6.77 | 38.31 |
| Nemotron Super 49B (FP8) | 172 | 11.57 | 12.09 |
| MiniMax M2.5 229B | 91 | 18.82 | 22.04 |
| GLM-5 744B | 1,341 | 33.56 | 31.86 |
| DeepSeek V3.2 685B | 931 | 21.34 | 22.32 |
Key Observations
- Nemotron Nano FP8 has the lowest TTFT at c=32 (206 ms) among all models, with TPOT under 8ms
- Nemotron Nano NVFP4 achieves similar latency on a single GPU: slightly higher TTFT (280 ms) due to TP=1 vs TP=2
- MiniMax M2.5 has the lowest TTFT at c=32 (91 ms) despite being a larger model, likely because TP=4 provides more compute for prefill
- GLM-5 has the highest TTFT at c=32 (1,341 ms) due to DSA's attention computation overhead during prefill, but reasonable TPOT (33.56 ms)
- All models achieve ITL p99 under 41ms at c=32, suitable for real-time streaming
Scaling Curves
Output Throughput vs Concurrency
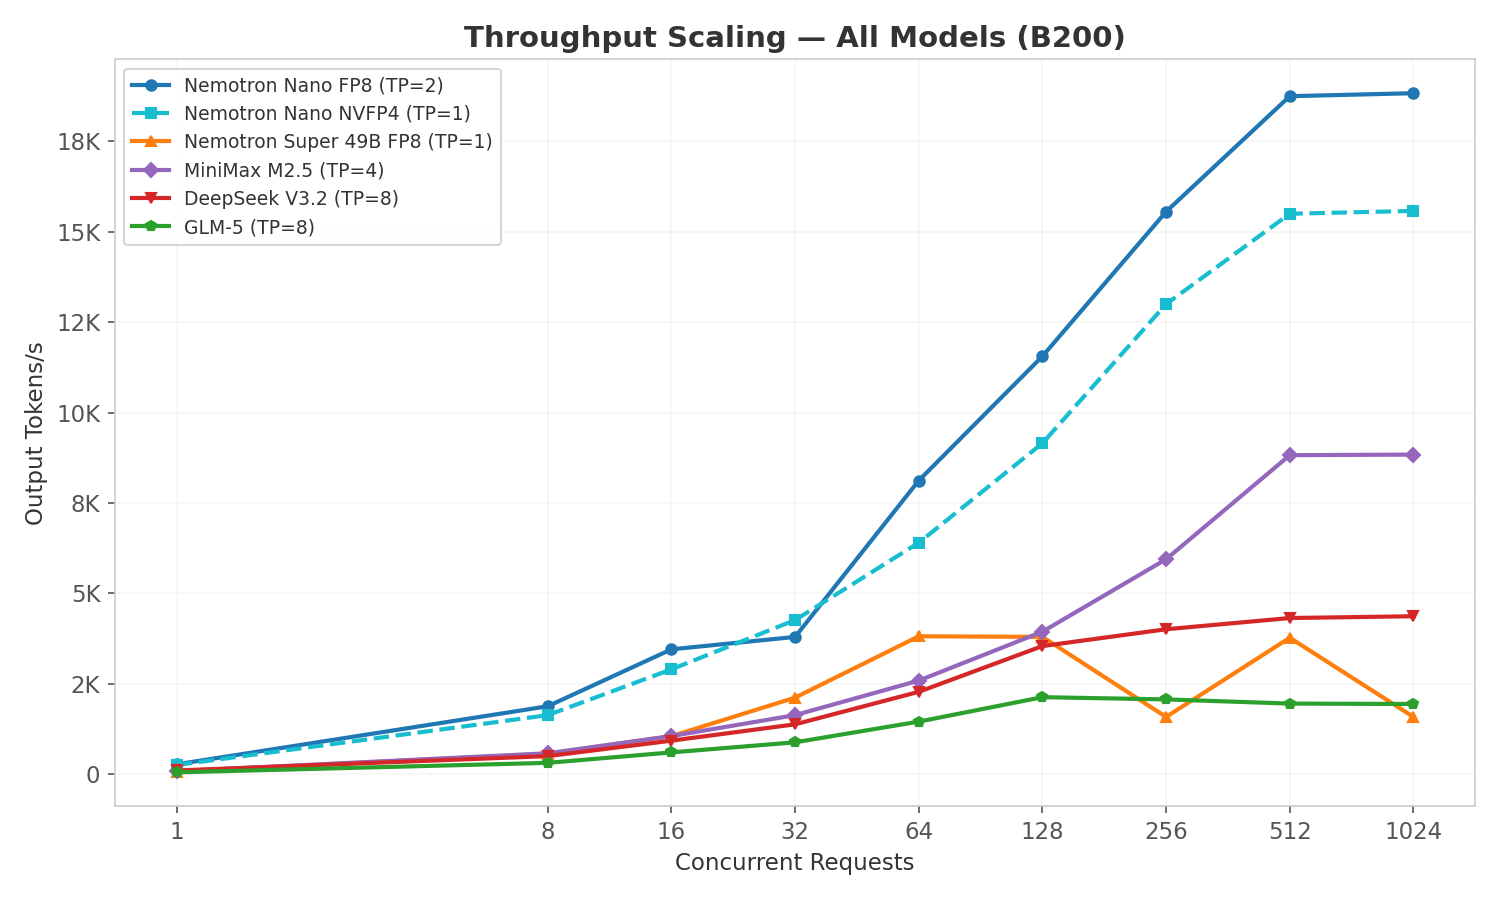
- Nemotron Nano FP8 (TP=2) leads at ~18,800 tok/s peak, with NVFP4 (TP=1) close behind at ~15,600 tok/s on a single GPU
- MiniMax M2.5 and both Nemotron variants plateau around c=512
- DeepSeek V3.2 scales well to c=512 (4,370 tok/s): MLA's compressed KV cache enables higher concurrency
- GLM-5 saturates earlier at ~c=128 (2,132 tok/s) due to its larger active parameter count (40B) and lower KV cache capacity
TPOT vs Concurrency
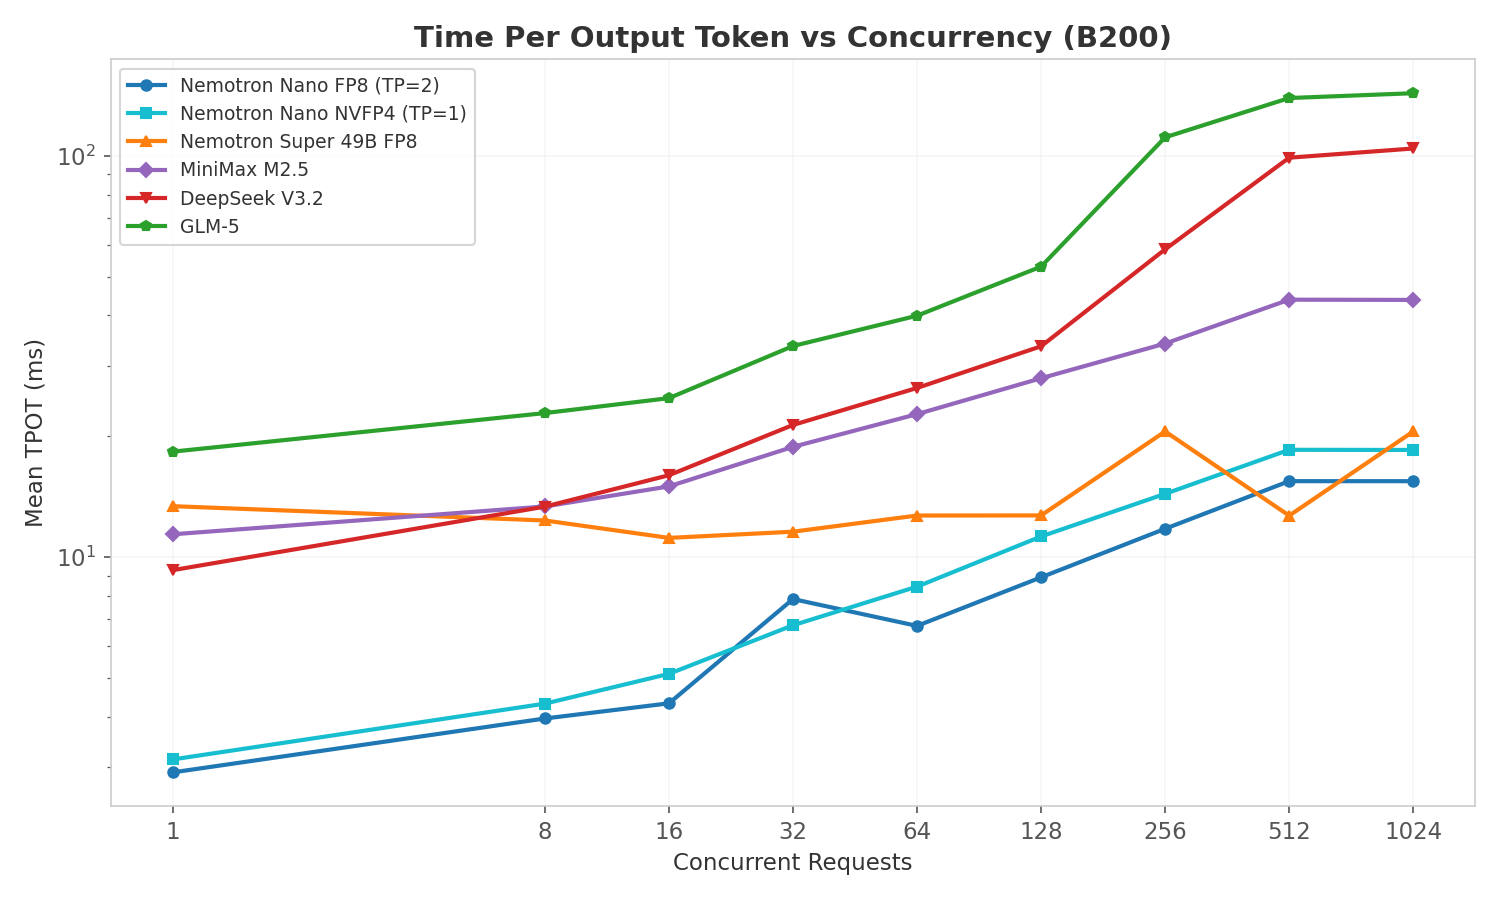
TPOT (decode latency) increases gradually with concurrency as batch sizes grow. Key observations:
- Nemotron Nano FP8/NVFP4 maintain the lowest TPOT across all concurrency levels (~3ms at c=1, ~15ms at c=512), reflecting the Mamba hybrid architecture's efficient decode phase
- GLM-5 and DeepSeek V3.2 show steeper TPOT growth at high concurrency: their larger active parameter counts (37-40B) consume more memory bandwidth per decode step
- Nemotron Super 49B stays remarkably flat (~12ms) up to c=128 before the oscillation pattern kicks in at c=256/1024
TTFT vs Concurrency
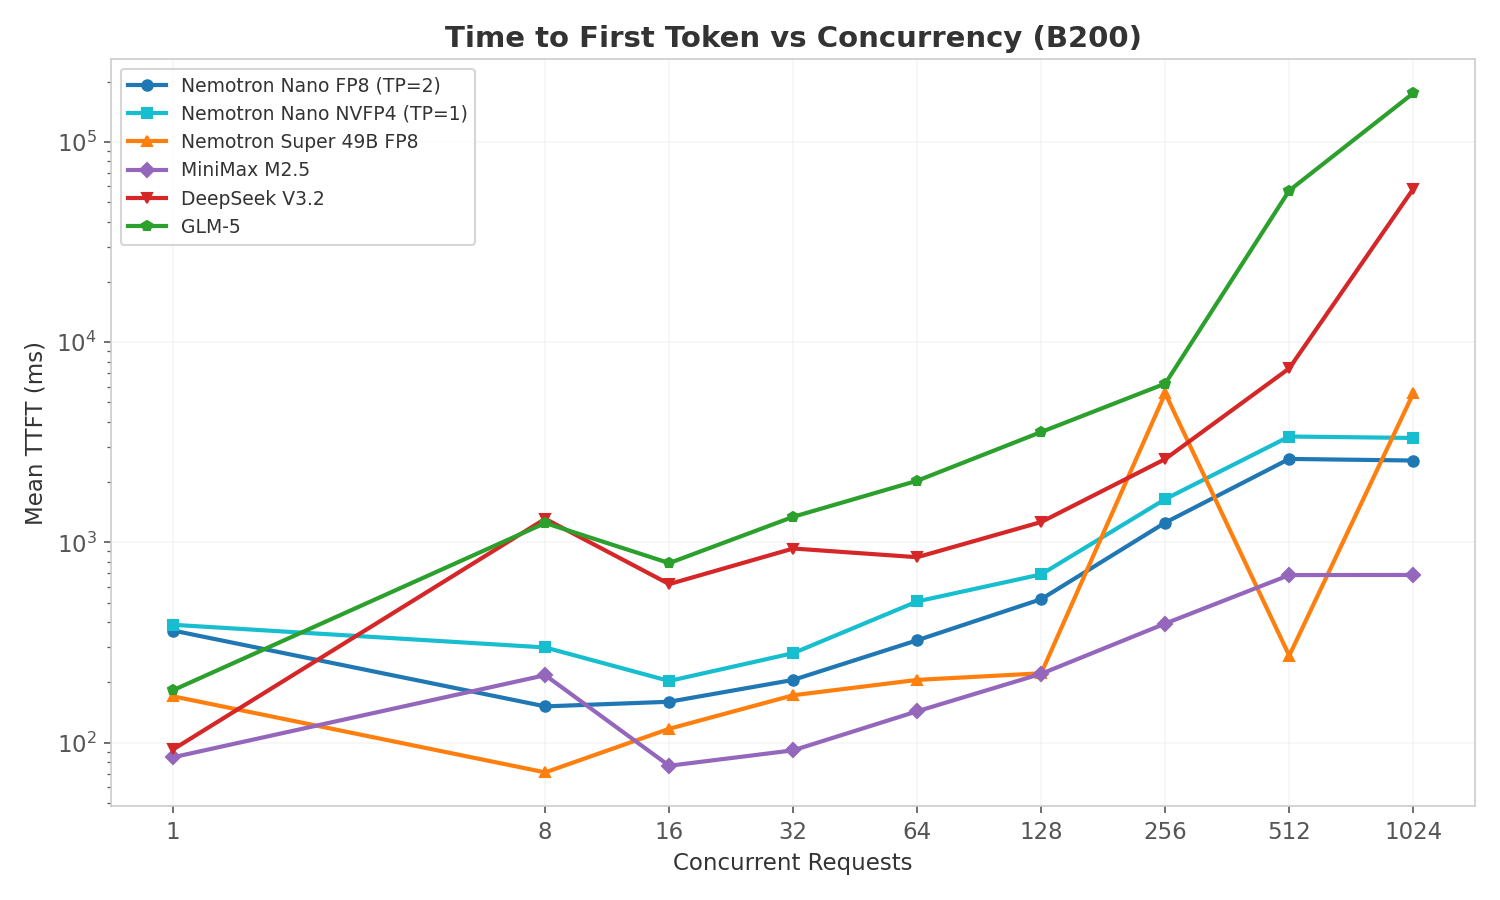
TTFT increases with concurrency as prefill requests queue behind active decode operations. MiniMax M2.5 maintains the lowest TTFT across the board due to having more GPUs (TP=4) handling prefill compute.
Per-GPU Throughput Efficiency
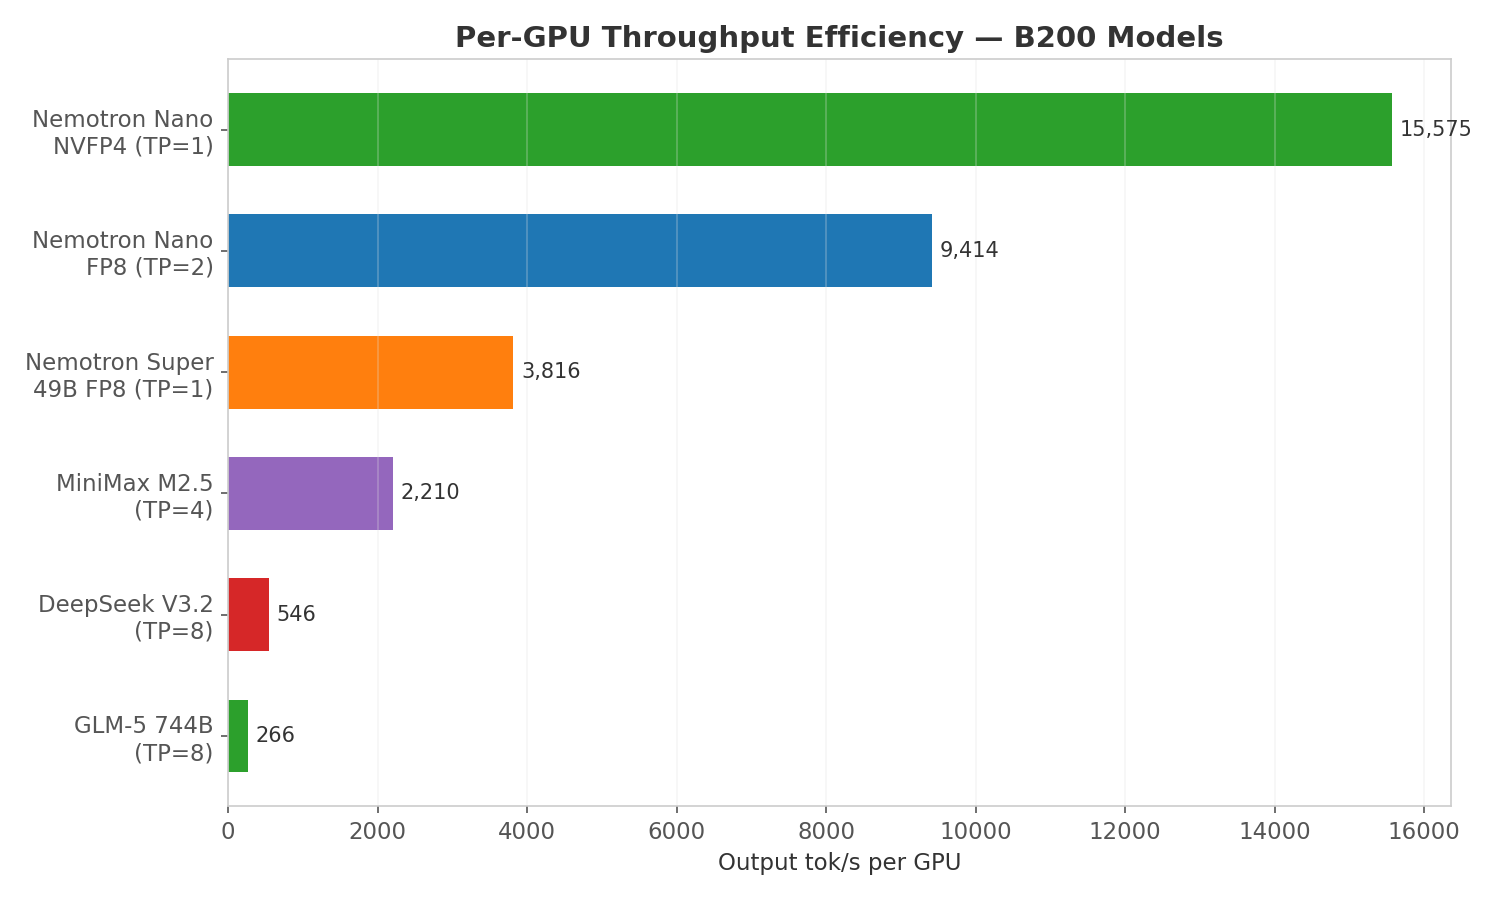
Per-GPU throughput normalizes for tensor parallelism, revealing how efficiently each model uses its allocated GPUs. Nemotron Nano NVFP4 achieves 15,575 tok/s on a single GPU: 1.65x more per-GPU throughput than the FP8 variant on 2 GPUs, and 58x more than GLM-5 per GPU. This metric drives deployment decisions: fewer GPUs per model instance means more instances per node and higher aggregate throughput.
Goodput (SLO-Constrained Throughput)
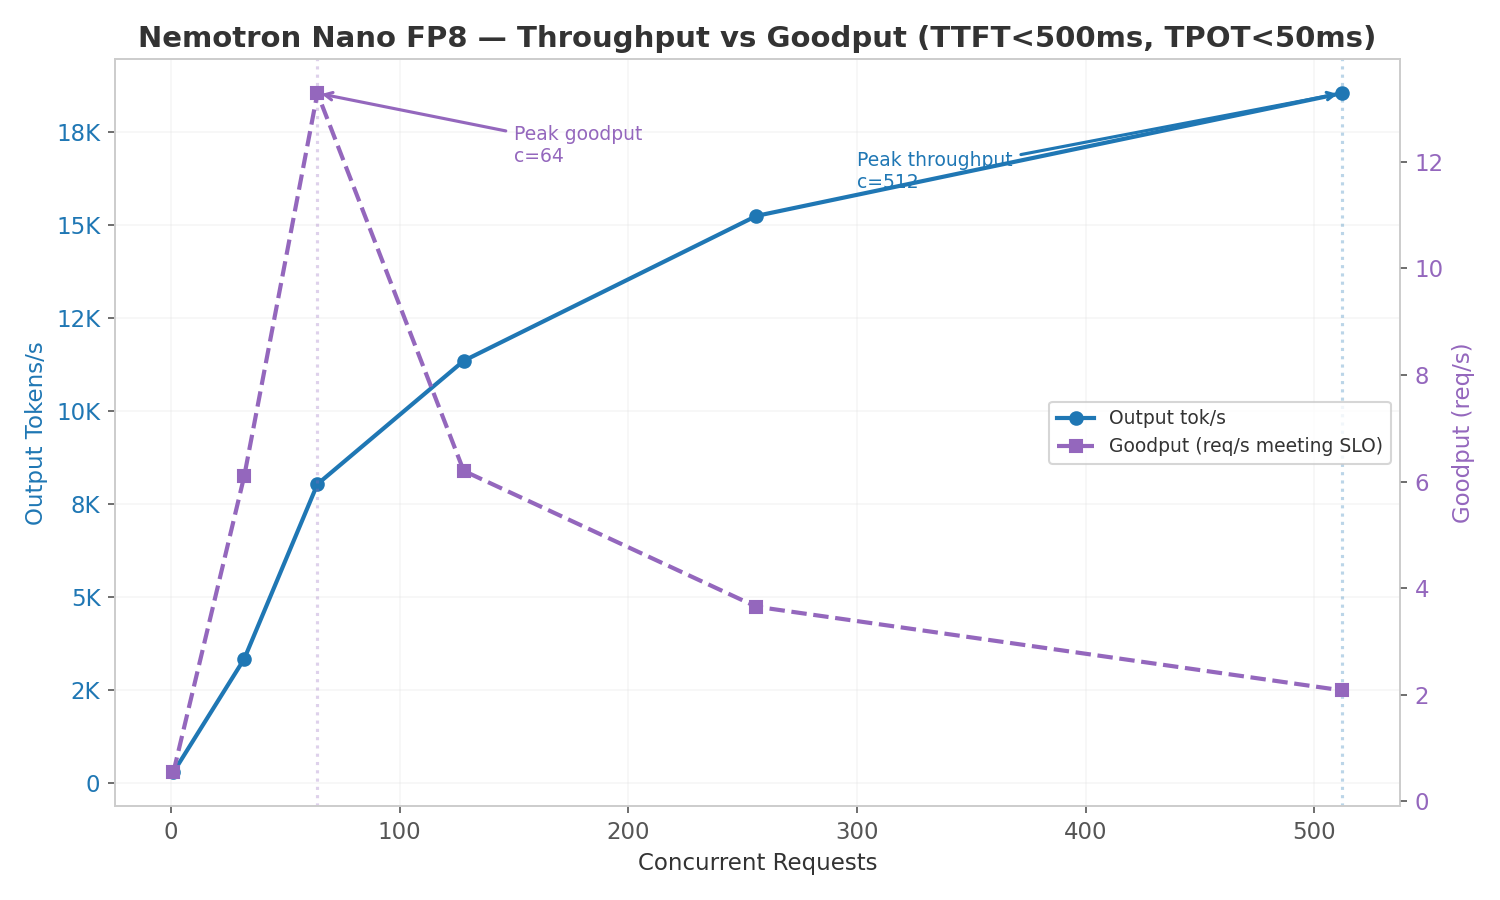
Raw throughput tells you the maximum output rate, but production deployments need to meet latency SLOs. Goodput measures how many requests per second meet all SLO targets simultaneously.
Tested on Nemotron Nano 30B FP8 (TP=2) with SLOs: TTFT < 500ms and TPOT < 50ms.
| Concurrency | Goodput (req/s) | Output tok/s | Mean TTFT (ms) | Mean TPOT (ms) |
|---|---|---|---|---|
| 1 | 0.54 | 281 | 363 | 2.85 |
| 32 | 6.10 | 3,331 | 688 | 8.10 |
| 64 | 13.29 | 8,027 | 349 | 6.79 |
| 128 | 6.20 | 11,343 | 727 | 8.72 |
| 256 | 3.65 | 15,237 | 1,377 | 11.78 |
| 512 | 2.08 | 18,535 | 2,614 | 15.70 |
Peak goodput is at c=64 (13.29 req/s), while peak throughput is at c=512+ (18,800+ tok/s). Beyond c=64, TTFT exceeds the 500ms SLO and goodput drops sharply: at c=512, only ~6% of requests meet both SLOs despite maximum throughput.
This demonstrates the classic throughput-vs-latency trade-off: the goodput-optimal concurrency is 8x lower than the throughput-optimal concurrency. Production deployments should target c=32–64 for interactive workloads with strict SLOs, and c=256–512 only for batch processing where latency is not critical.
Goodput: FP8 (TP=2) vs NVFP4 (TP=1)
| Concurrency | FP8 Goodput (req/s) | NVFP4 Goodput (req/s) | FP8 TTFT (ms) | NVFP4 TTFT (ms) |
|---|---|---|---|---|
| 1 | 0.54 | 0.54 | 363 | 210 |
| 32 | 6.10 | 7.21 | 688 | 487 |
| 64 | 13.29 | 8.90 | 349 | 427 |
| 128 | 6.20 | 8.24 | 727 | 682 |
| 256 | 3.65 | 8.87 | 1,377 | 1,589 |
| 512 | 2.08 | 0.55 | 2,614 | 3,341 |
FP8 peaks at 13.29 req/s (c=64), NVFP4 peaks at 8.90 req/s (c=64). FP8 has higher peak goodput because TP=2 distributes prefill across 2 GPUs, keeping TTFT lower at moderate concurrency. However, NVFP4 maintains more consistent goodput across c=32–256 (7.21–8.87 req/s) while FP8 drops sharply past c=64. NVFP4 still wins on per-GPU efficiency: it achieves 8.90 goodput req/s on 1 GPU vs FP8's 13.29 on 2 GPUs, delivering better per-GPU throughput even under SLO constraints.
Startup Times (Model Already Cached)
| Configuration | Weight Load | Total Startup | Notes |
|---|---|---|---|
| Nemotron Nano NVFP4 (TP=1) | 3.6s | ~41s | Single GPU, fastest |
| Nemotron Nano FP8 (TP=2) | 4.6s | ~70s | 2 GPUs, NVLink init |
Startup times measured with models already in HuggingFace cache. First-time downloads add 1–5 minutes depending on model size and network speed.
Why Mostly MoE?
Four of the five models in this cookbook use Mixture of Experts (MoE) architecture. This reflects the current state of open-source LLMs:
- No dense model above 100B has been released since Llama 3.1 405B (July 2024)
- Every major open-source model since mid-2024 uses MoE: DeepSeek V3, GLM-5, MiniMax M2.5, Qwen3, Llama 4
- MoE enables larger total parameter counts (more knowledge capacity) while keeping per-token compute manageable
The exception is Nemotron Super 49B, a dense NAS-optimized transformer based on Llama 3.3. It was included specifically because its standard attention architecture is compatible with NVIDIA Dynamo's NIXL KV transfer for disaggregated serving: a key testing requirement the MoE models could not satisfy.
Architecture Diversity
The five models represent five distinct attention mechanisms:
| Model | Architecture | Attention Type | Key Property |
|---|---|---|---|
| Nemotron Nano 30B | MoE | Mamba (SSM) + Transformer hybrid | No KV cache for SSM layers, O(n) time |
| Nemotron Super 49B | Dense | Standard multi-head attention | Full KV cache, compatible with NIXL |
| MiniMax M2.5 229B | MoE | Lightning Attention (linear + SoftMax) | O(n) intra-chunk, standard inter-chunk |
| GLM-5 744B | MoE | Differential Sparse Attention (DSA) | Selectively attends to important tokens |
| DeepSeek V3.2 685B | MoE | Multi-Latent Attention (MLA) | Compressed KV via latent projections |
This diversity means each model has fundamentally different memory and compute characteristics during inference, making them interesting comparison points beyond raw throughput numbers.