

Monitoring a Kubernetes cluster is an essential task for any Kubernetes administrator. It will help you to ensure that all Kubernetes services are up and running. Many solutions are available to track and monitor cluster resources, including memory, CPU, and storage. Prometheus and Grafana are one of the most popular Kubernetes monitoring stacks.
Deploying Prometheus with Grafana helps you to verify if nodes are functioning properly and at the right capacity. Prometheus allows you to capture different metrics in Kubernetes, while Grafana is a data visualization platform that pulls up metrics from Prometheus and transforms metrics into meaningful visualizations.
This article explains the steps to set up Prometheus and Grafana monitoring stack on Vultr Kubernetes Engine (VKE) using Prometheus-Operator.
Prerequisites
Before you begin, you should:
- Have a Vultr Kubernetes Engine cluster.
- Have the Kubectl installed and configured on your local machine.
- Have a Helm installed on your local machine..
Add Prometheus Helm Chart
Prometheus Helm chart contains a group of four monitoring tools, including Prometheus, Grafana, Alertmanager, and Prometheus operator, to monitor the Kubernetes cluster.
Create a
monitoringnamespace.# kubectl create namespace monitoringSample output.
namespace/monitoring createdAdd the Prometheus community Helm chart.
# helm repo add prometheus-community https://prometheus-community.github.io/helm-chartsUpdate the Helm repository.
# helm repo updateVerify the added Helm chart.
# helm repo listSample output.
 NAME URL
 prometheus-community https://prometheus-community.github.io/helm-charts
Install Prometheus Stack
At this point, the Prometheus Helm chart is ready to deploy the full Prometheus Kubernetes monitoring stack.
Now, run the helm install command to deploy the Prometheus stack on Kubernetes.
# helm install prometheus prometheus-community/kube-prometheus-stack --namespace monitoringSample output.
 NAME: prometheus
 LAST DEPLOYED: Wed Dec 28 04:04:04 2022
 NAMESPACE: monitoring
 STATUS: deployed
 REVISION: 1
 NOTES:
 kube-prometheus-stack has been installed. Check its status by running:
 kubectl --namespace monitoring get pods -l "release=prometheus"
Verify the Kubernetes Prometheus deployment.
# kubectl get pods -n monitoringSample output.
 NAME READY STATUS RESTARTS AGE
 alertmanager-prometheus-kube-prometheus-alertmanager-0 2/2 Running 1 (3m12s ago) 3m18s
 prometheus-grafana-7bdd794646-5jzht 3/3 Running 0 3m27s
 prometheus-kube-prometheus-operator-77dc45b447-scllf 1/1 Running 0 3m27s
 prometheus-kube-state-metrics-6cfd96f4c8-rqbs5 1/1 Running 0 3m27s
 prometheus-prometheus-kube-prometheus-prometheus-0 2/2 Running 0 3m18s
 prometheus-prometheus-node-exporter-6nmn8 1/1 Running 0 3m27s
 prometheus-prometheus-node-exporter-f8vmf 1/1 Running 0 3m27s
 prometheus-prometheus-node-exporter-kbpgw 1/1 Running 0 3m27s
Access Prometheus Dashboard
Prometheus is now deployed on Kubernetes and is ready to monitor Kubernetes metrics. However, you can not access Prometheus from the external network. You will need to run the kubectl port-forward command to forward a local port 9090 to your cluster.
Run the
kubectl getcommand to check Prometheus services.# kubectl get svc -n monitoringThis will show you all services deployed in the Kubernetes cluster.
 NAME TYPE CLUSTER-IP EXTERNAL-IP PORT(S) AGE
 alertmanager-operated ClusterIP None <none> 9093/TCP,9094/TCP,9094/UDP 3m33s
 prometheus-grafana ClusterIP 10.102.128.108 <none> 80/TCP 3m42s
 prometheus-kube-prometheus-alertmanager ClusterIP 10.103.242.106 <none> 9093/TCP 3m42s
 prometheus-kube-prometheus-operator ClusterIP 10.98.140.171 <none> 443/TCP 3m42s
 prometheus-kube-prometheus-prometheus ClusterIP 10.106.123.111 <none> 9090/TCP 3m42s
 prometheus-kube-state-metrics ClusterIP 10.105.119.117 <none> 8080/TCP 3m42s
 prometheus-operated ClusterIP None <none> 9090/TCP 3m33s
 prometheus-prometheus-node-exporter ClusterIP 10.101.98.49 <none> 9100/TCP 3m42s
Pick the Prometheus service
prometheus-kube-prometheus-prometheusfrom the above output and run thekubectl port-forwardcommand to forward a local port9090.# kubectl port-forward svc/prometheus-kube-prometheus-prometheus -n monitoring 9090 &Sample output.
 Forwarding from 127.0.0.1:9090 -> 9090
 Forwarding from [::1]:9090 -> 9090
Open your web browser and navigate to
http://localhost:9090. If the Prometheus service works, you should see the following screen.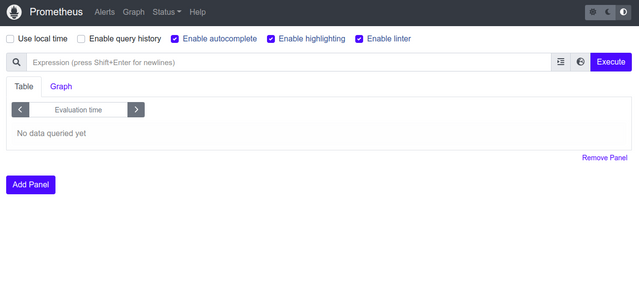
Access Kube-state-metrics (KSM)
Kube-state-metrics (KSM) tool allows you to see the Kubernetes cluster's internal state metrics. It will help you to monitor resource usage, health statistics, node metrics, deployment metrics, and pod metrics via a web browser.
Run the following command to check the
kube-state-metricsstatus.# kubectl get svc -n monitoring | grep kube-state-metricsSample output.
prometheus-kube-state-metrics ClusterIP 10.105.119.117 <none> 8080/TCP 4m38sUse the
prometheus-kube-state-metricsfrom the above output and run thekubectl port-forwardcommand to forward a local port8080.# kubectl port-forward svc/prometheus-kube-state-metrics -n monitoring 8080 &Sample output.
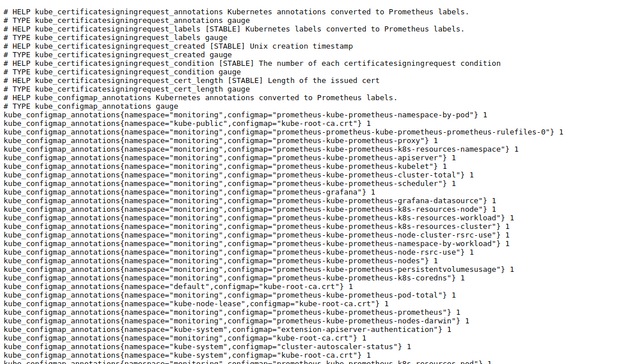
 Forwarding from 127.0.0.1:8080 -> 8080
 Forwarding from [::1]:8080 -> 8080
Open your web browser and access the Kube-state-metrics (KSM) dashboard using the URL
http://localhost:8080. You should see the Kubernetes internal state metrics on the following screen.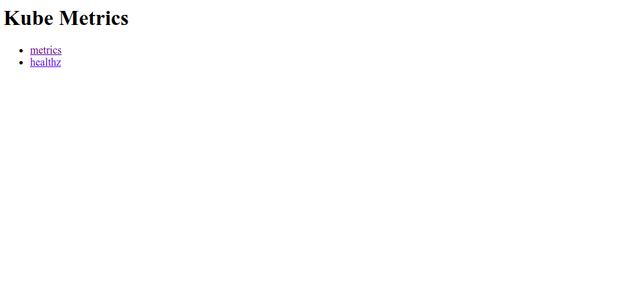
Visualize Kubernetes Internal State Metric Via Prometheus
Access the Prometheus endpoints using the URL
http://localhost:9090/targetsand verify whether these targets have been properly configured. You should see Kubernetes internal and monitoring components on the following screen.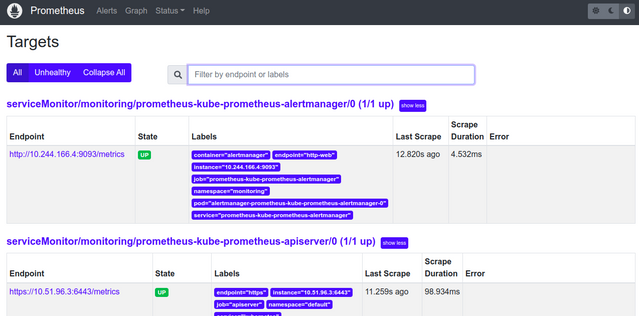
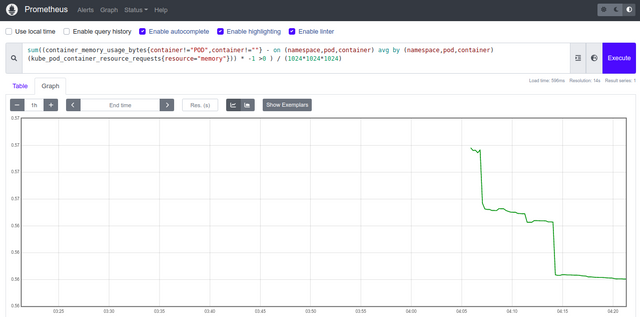
Click the Graph menu and type the PromQL query in the expression space.
sum((container_memory_usage_bytes{container!= "POD",container!=""} - on (namespace,pod,container) avg by (namespace,pod,container) (kube_pod_container_resource_requests{resource= "memory"})) * -1 >0 ) / (1024*1024*1024)Click the Execute. You should see the total amount of unused memory in your cluster in a graphical format.
Access Grafana Dashboard
Grafana is a very useful tool for visualizing Kubernetes matrics and workloads in a graphical format.
Before accessing the Grafana dashboard, you must retrieve the Grafana login password stored as a secret in Kubernetes. Run the
kubectlcommand followed by Grafana serviceprometheus-grafanato view data stored as a secret in the Kubernetes cluster.# kubectl get secret -n monitoring prometheus-grafana -o yamlYou should see the admin-password in base64 format in the following output.
 apiVersion: v1
 data:
 admin-password: cHJvbS1vcGVyYXRvcg==
 admin-user: YWRtaW4=
 ldap-toml:""
 kind: Secret
 metadata:
 annotations:
 meta.helm.sh/release-name: prometheus
 meta.helm.sh/release-namespace: monitoring
 creationTimestamp: "2022-12-28T04:04:40Z"
 labels:
 app.kubernetes.io/instance: prometheus
 app.kubernetes.io/managed-by: Helm
 app.kubernetes.io/name: grafana
 app.kubernetes.io/version: 9.3.1
 helm.sh/chart: grafana-6.48.0
 name: prometheus-grafana
 namespace: monitoring
 resourceVersion: "2287"
 uid: f52d3bf0-c087-494f-ada0-794353930a36
 type: Opaque
Copy the admin-password value
cHJvbS1vcGVyYXRvcg==from the above output and decode it using the following command.# echo cHJvbS1vcGVyYXRvcg== | base64 --decodeYou should see the Grafana admin password in the following output.
prom-operatorRun the
kubectlcommand to port-forward Grafana port80to a local port at3000.# kubectl port-forward svc/prometheus-grafana -n monitoring 3000:80 &Sample output.
 Forwarding from 127.0.0.1:3000 -> 3000
 Forwarding from [::1]:3000 -> 3000
Open your web browser and access Grafana using the URL
http://localhost:3000. You should see the Grafana login screen.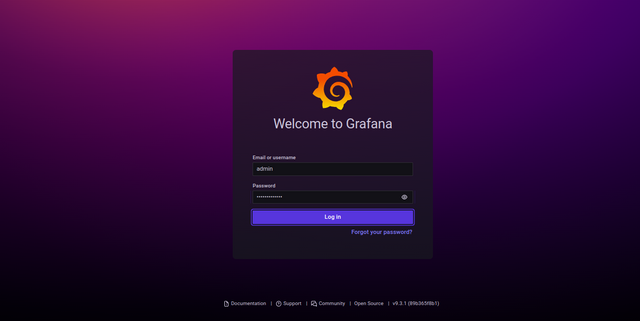
Enter the username as
adminand password asprom-operator, then click on the Log in button. You should see the Grafana dashboard on the following screen.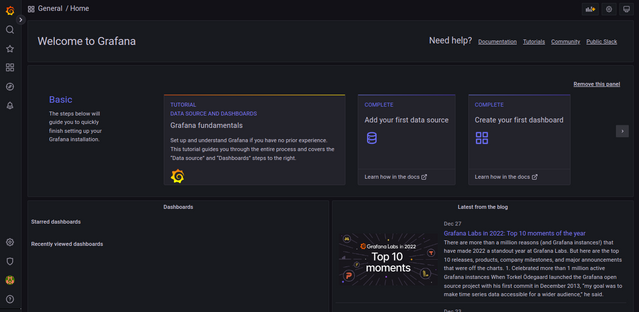
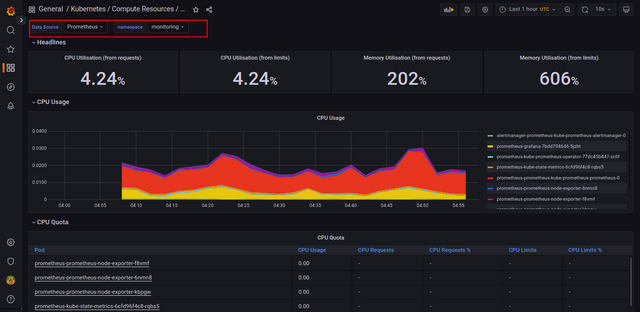
By default, Grafana has pre-configured dashboards for each target, so you don't need to set up a dashboard to visualize Prometheus metrics. Click on the Dashboard => Browse. You should see all pre-configured dashboards on the following screen.
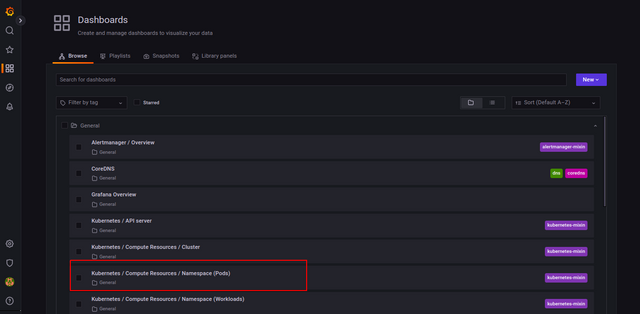
Click the Kubernetes / Compute Resources / Namespace (Pods) dashboard. You should see the dashboard for visualizing compute resource usage by Pods in the monitoring namespace.
Conclusion
In this post, you learned how to set up Prometheus and Grafana on Vultr Kubernetes using a Helm chart. You also learned how to visualize Kubernetes internal metrics and display them on the Grafana dashboard. You can now explore Prometheus and Grafana features and start monitoring your Kubernetes cluster.
No comments yet.