Introduction
Prometheus is an open-source monitoring and alerting toolkit designed primarily for reliability and scalability. It collects and stores its metrics as time series data, i.e., metrics information is stored with the timestamp at which it was recorded, along with optional key-value pairs called labels.
This article explains how to use Vultr's Prometheus Marketplace Application. You will test the Prometheus Deployment and view the metrics collection done by Prometheus by running queries.
Deploy Prometheus Marketplace Application on Vultr
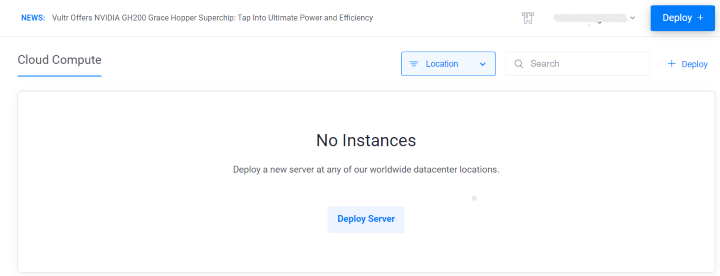
Login to your Vultr Customer Portal and click the Deploy Server button.

Select Optimized Cloud Compute as a server type.

Choose a nearby server location amongst the 32 global locations.

Select Prometheus as the Marketplace Application.

Select a server size as per requirements.

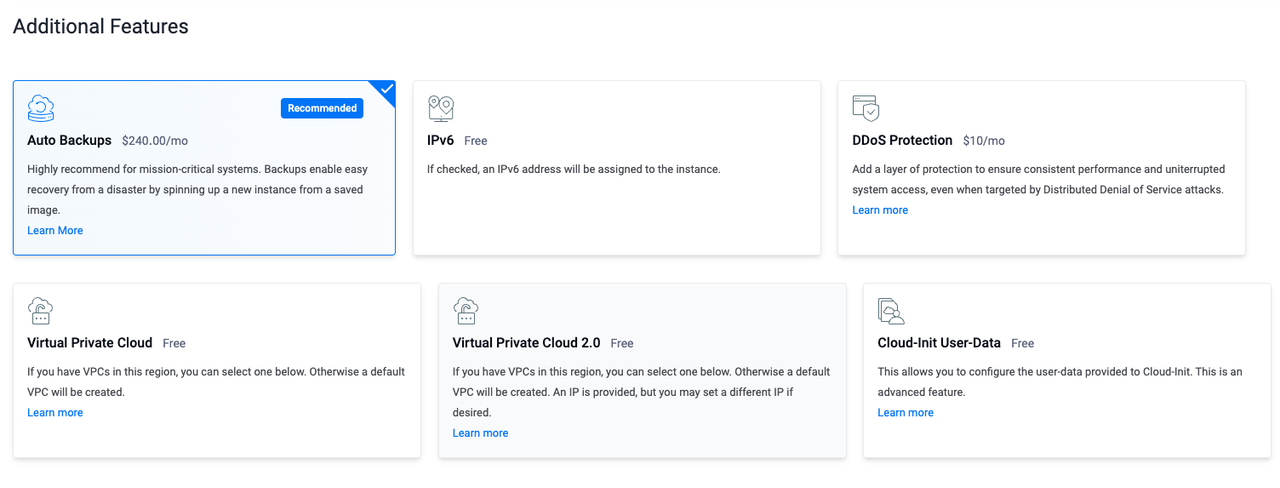
Choose any Additional Features as per requirements.

Click the Deploy Now button to start the instance deployment.

Once the instance is deployed go to the server details and copy the SSH details.

Understand Prometheus Components
Prometheus Server
Core Function: The core part of the system, responsible for scraping and storing time series data.
Components:
- Data Retrieval: Pulls metrics from configured endpoints.
- Time Series Database (TSDB): Stores all the scraped metrics efficiently.
- Querying Engine: Provides a powerful query language called PromQL to fetch and aggregate data.
Exporters
- Function: Exporters are services that generate metrics. They are responsible for exposing metrics of various systems (like Linux servers, databases, applications, etc.) in a format Prometheus understands.
- Node Exporter: For hardware and OS metrics.
- Custom Exporters: For custom application metrics.
- Function: Exporters are services that generate metrics. They are responsible for exposing metrics of various systems (like Linux servers, databases, applications, etc.) in a format Prometheus understands.
Pushgateway
- Function: A gateway that allows short-lived jobs to push their metrics to Prometheus. While Prometheus is pull-based, the Pushgateway enables push-based metrics collection.
Alertmanager
- Function: Handles alerts sent by Prometheus. It manages the lifecycle of alerts, including silencing, inhibition, aggregation, and sending notifications.
Explore Prometheus Dashboard
Access the Prometheus Dashboard.
The username and password to access the dashboard are provided in the Overview section of the server page.
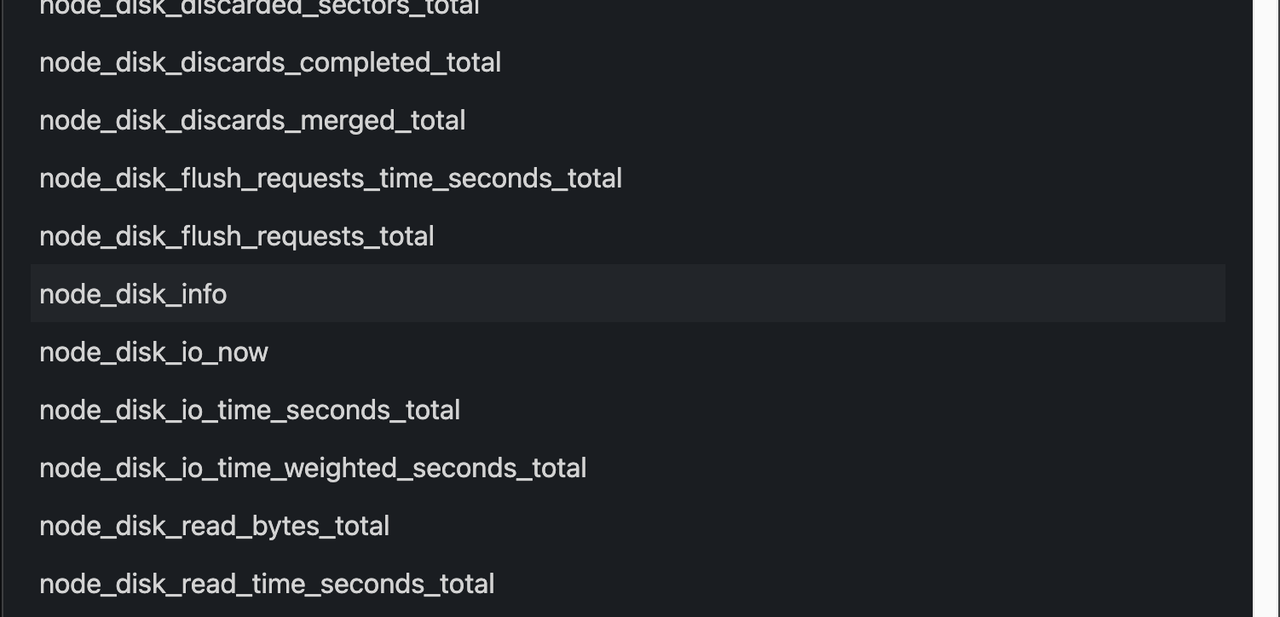
Open the metrics explorer.

Select any metric option in the metrics explorer.

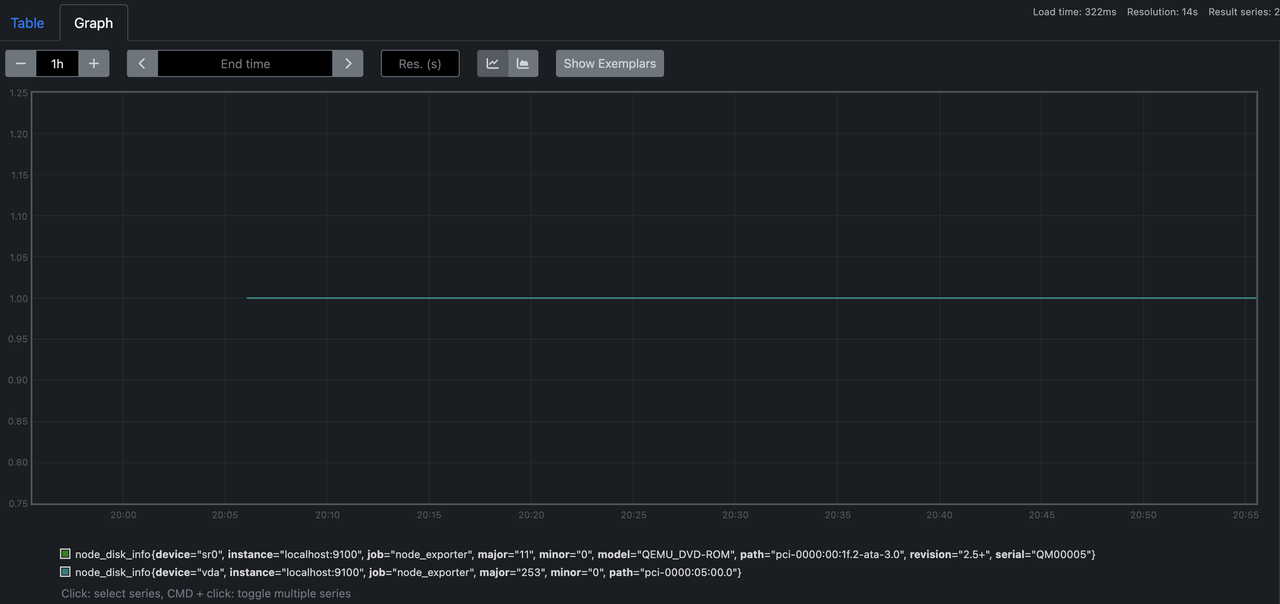
Click execute to view the metric.

Metrics collection data will be displayed in a table format.

You can also switch to a graph to have an interactive view.

Optional: Configure Prometheus with Grafana.
Add Prometheus as a data source in Grafana and fill out the required details with the Prometheus server IP and credentials used to access the Prometheus server.
Conclusion
In this article, you deployed Vultr's Prometheus Marketplace Application. You performed operations utilizing the features and capabilities of Prometheus. With pre-installed Marketplace Application on a Vultr server developers can save hours of setup time and focus on actual application development.