
Introduction
Grafana is an open-source platform for visualizing and analyzing data from various sources. It allows users to create interactive dashboards and real-time monitoring with customizable graphs and charts. With its extensive plugin ecosystem, Grafana supports integration with numerous data sources and tools. It's widely used for tracking system performance and gaining actionable insights from complex data sets.
This article explains how to use Vultr's Grafana Marketplace Application. You will test the Grafana deployment by creating a sample dashboard and running visualizations on mock data.
Deploy Garfana Marketplace Application on Vultr
Login to your Vultr Customer Portal and click the Deploy Server button.
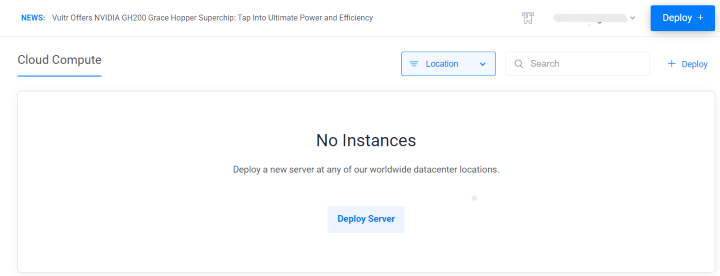
Select Optimized Cloud Compute as a server type.

Choose a nearby server location amongst the 32 global locations.

Select Grafana as the Marketplace Application.

Select a server size as per requirements.

Choose any Additional Features as per requirements.
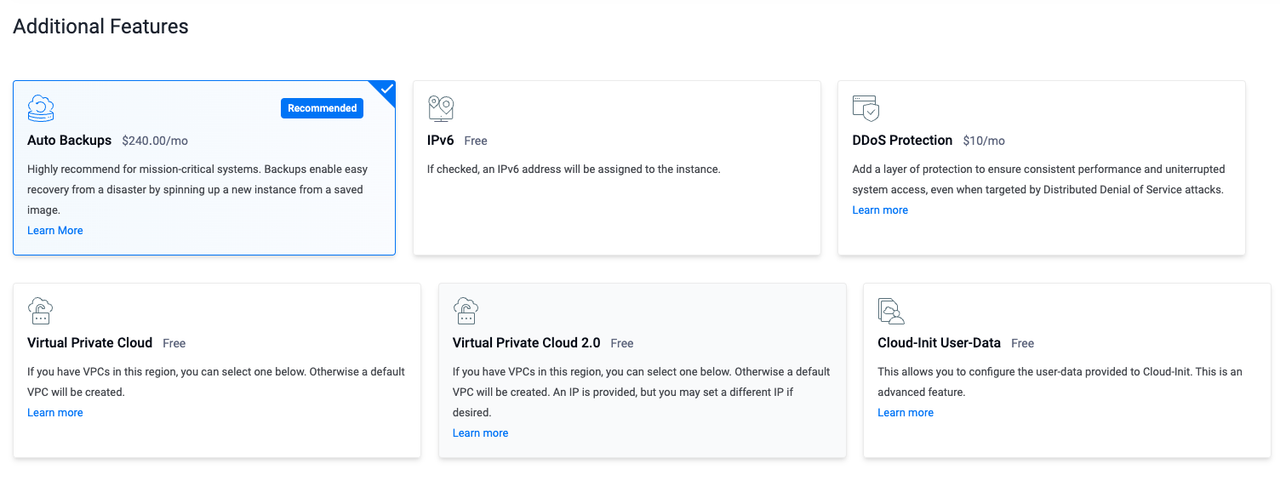
Click the Deploy Now button to start the instance deployment.

Once the instance is deployed go to the server details and copy the SSH details.

Understand Grafana Components
Dashboards: Customizable pages for displaying and organizing visualizations.
Panels: Individual visualizations, like graphs or tables, within dashboards.
Data Sources: Integrations with databases and monitoring systems for pulling in data.
Alerts: Notifications triggered by specific conditions in the data.
Plugins: Extensions that add functionality, such as new data sources or visualization types.
Annotations: Contextual markers on visualizations for highlighting events.
Templating: Dynamic dashboards with variables for flexible data views.
Explore Grafana Dashboard
Access the Grafana Dashboard.
The username and password to access the dashboard are provided in the Overview section of the server page.
Select DASHBOARDS on the home screen.

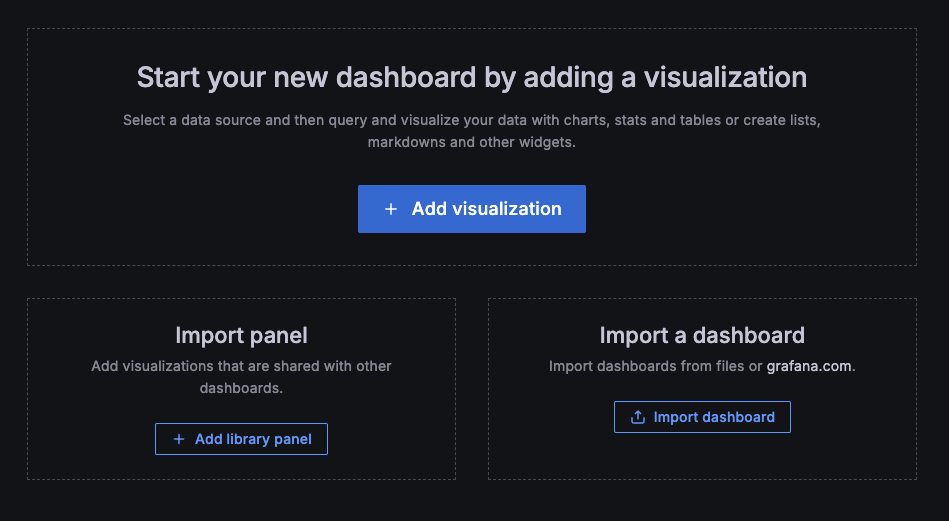
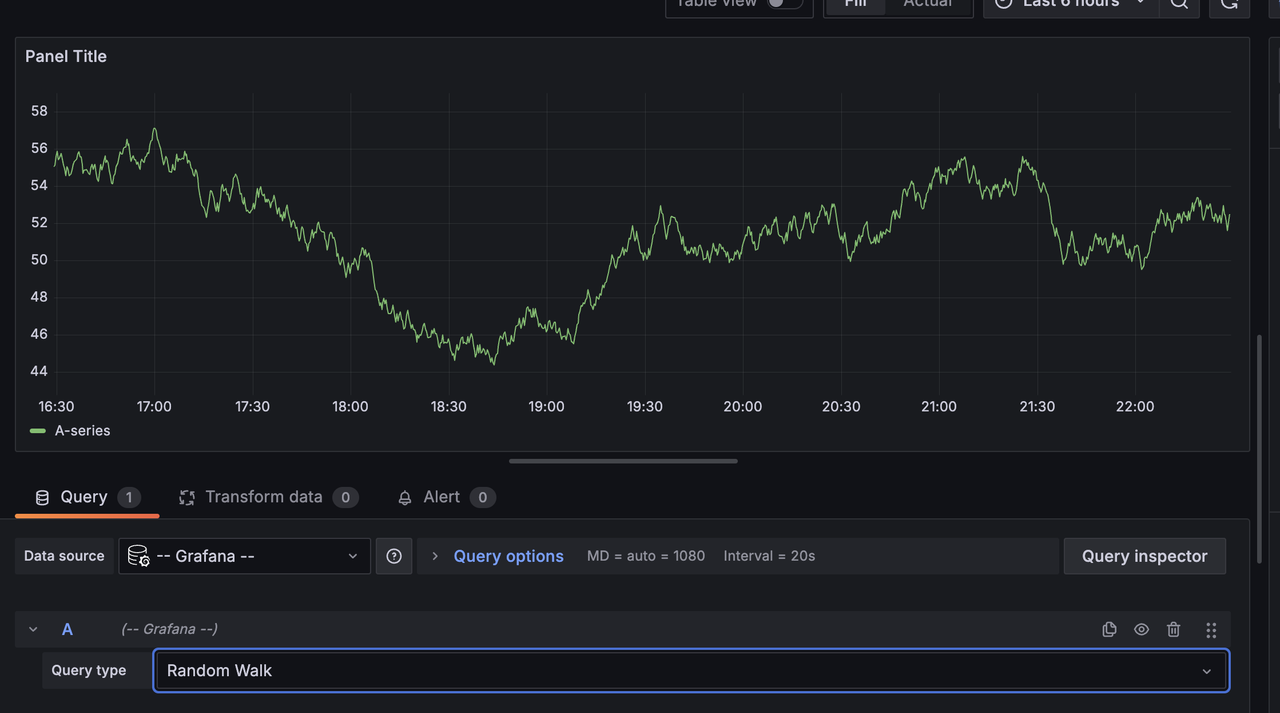
Click Add Visualization.
Select Grafana to create Visualizations using mock data.
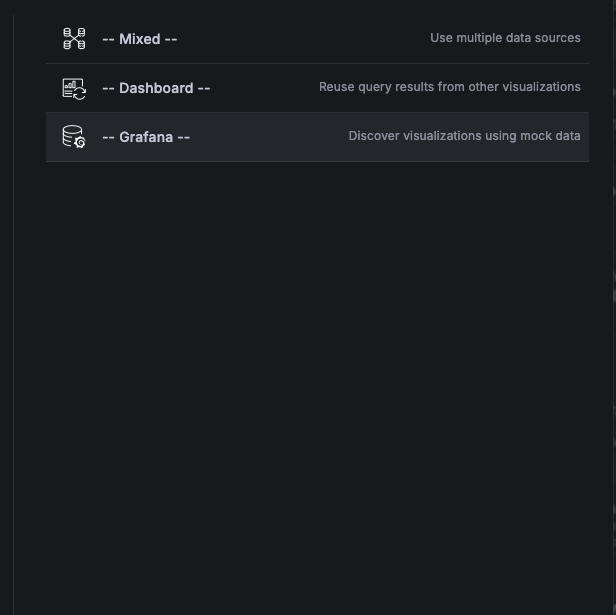
Click Add query.

Select a query and run it to see the visualization chart on the dashboard.
Conclusion
In this article, you deployed Vultr's Grafana Marketplace Application. You tested the deployment by creating a sample dashboard. With pre-installed Marketplace Application on a Vultr server developers can save hours of setup and configuration time and focus on actual application development.