
How to Use Vultr's Uptime Kuma Marketplace Application
Uptime Kuma is a self-hosted monitoring tool that enables users to track the uptime and status of their websites, applications, and services. It supports various monitoring types, including HTTP(s), TCP port, ping, and DNS checks. Uptime Kuma provides a user-friendly dashboard for real-time status visualization and offers customizable notifications through multiple channels such as email, Telegram, Slack, and Discord. It's designed to be easy to setup and flexible, making it suitable for personal and professional use to ensure service reliability and performance.
This article explains how to use Vultr's Uptime Kuma Marketplace Application, you will explore the core features like creating monitors and setting up notifications in the Uptime Kuma dashboard.
Deploy Uptime Kuma Marketplace Application on Vultr
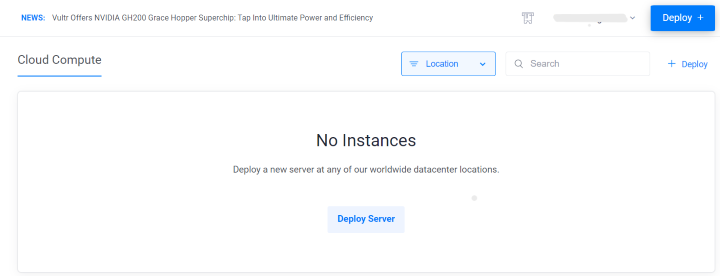
Login to your Vultr Vultr Console and click the Deploy Server button.
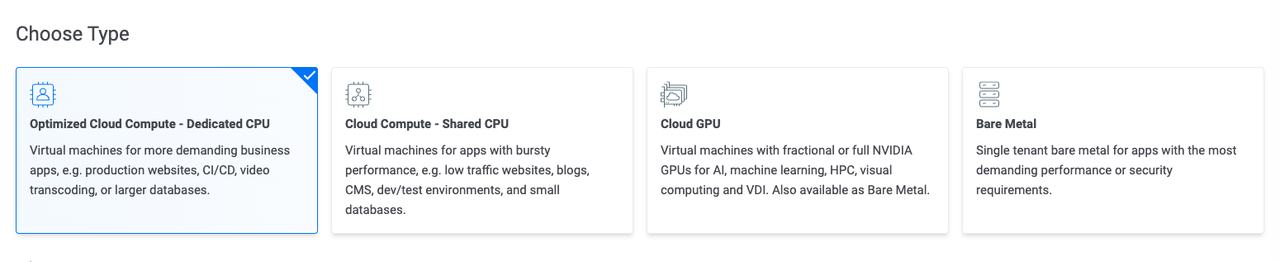
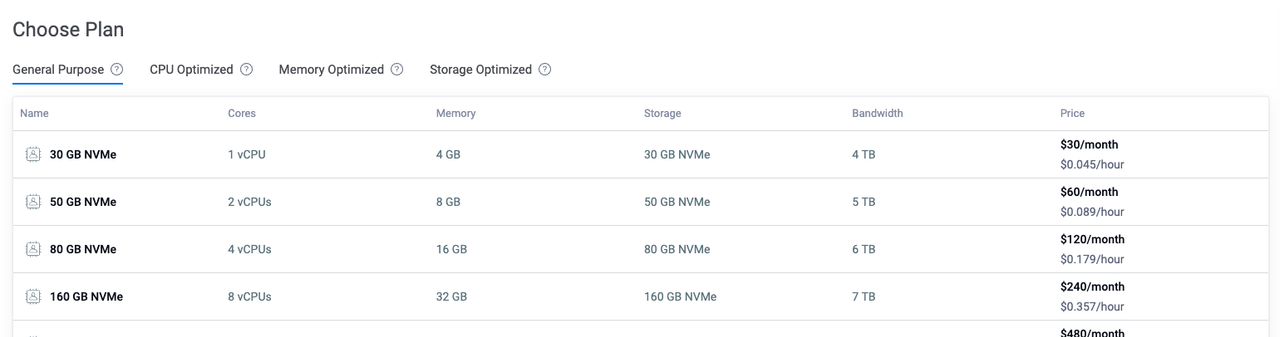
Select Optimized Cloud Compute as a server type.
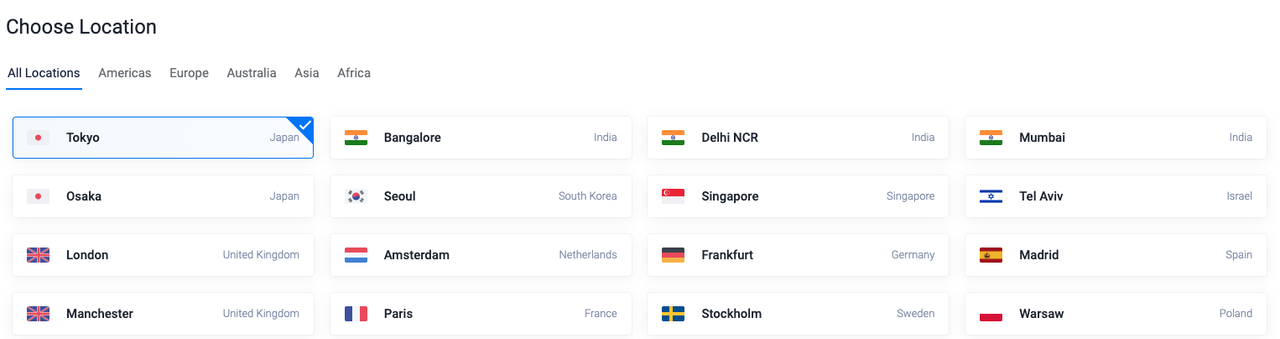
Choose a nearby server location amongst the 33 global locations.
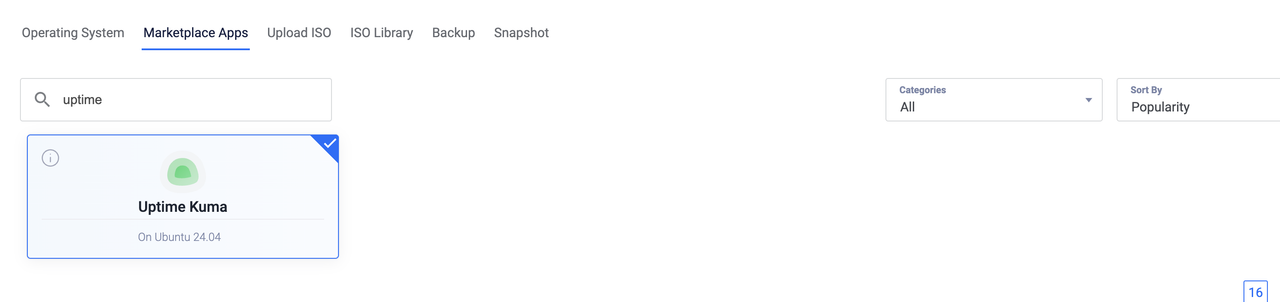
Select Uptime Kuma as the Marketplace Application.
Select a server size as per requirements.
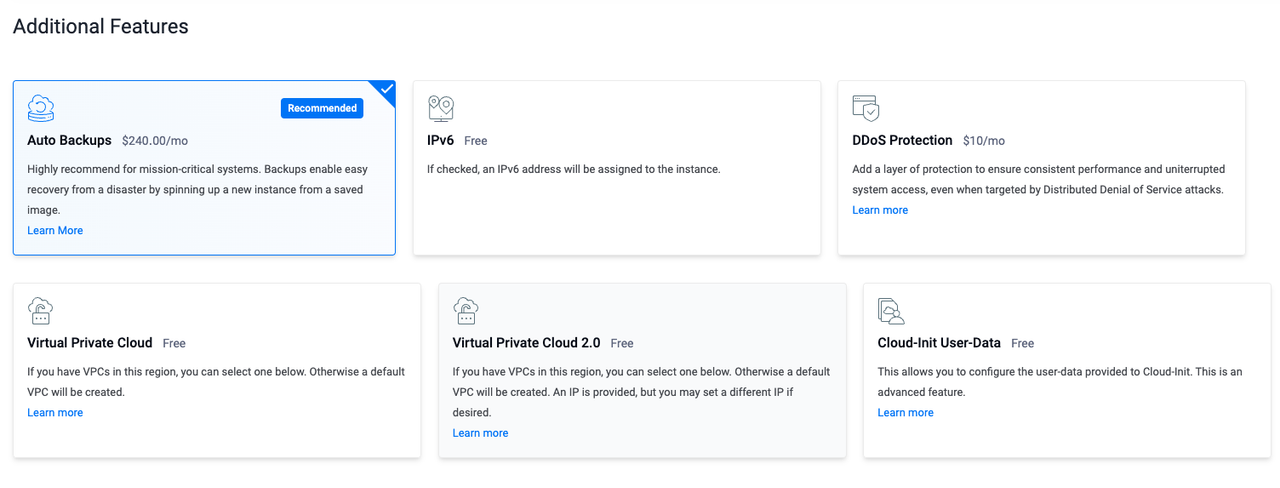
Choose any Additional Features as per requirements.
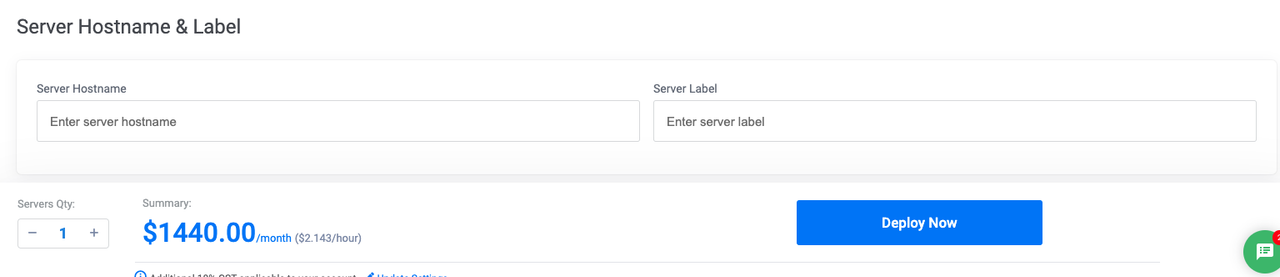
Click the Deploy Now button to start the instance deployment.
Once the instance is deployed go to the server details and copy the SSH details.

Core Features of Uptime Kuma
Multi-Protocol Monitoring: Supports HTTP(s), TCP Port, Ping, and DNS checks to monitor various types of services and ensure their availability.
Customizable Notifications: Offers notifications through email, Telegram, Slack, Discord, and webhooks, allowing users to stay informed about service status changes in real- time.
User-Friendly Dashboard: Provides a real-time status visualization dashboard with detailed uptime reports, making it easy to monitor and analyze service performance.
Incident Management: Tracks downtime and uptime, logs incidents, and provides historical data to help diagnose and resolve issues quickly.
Easy Setup and Configuration: A self-hosted solution that is simple to install and configure, ensuring users can quickly get started with minimal effort.
Explore Uptime Kuma Dashboard
Access the Uptime Kuma Dashboard.
To access the dashboard you can visit
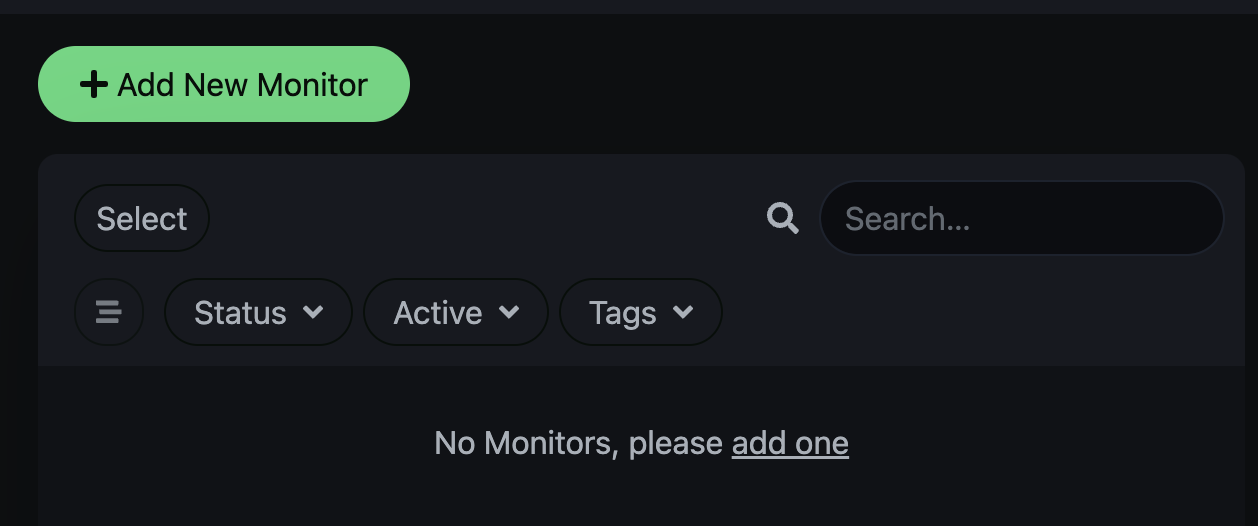
http://<server-ip>in your browser.To add website monitoring click Add New Monitor in the top left corner of the dashboard.
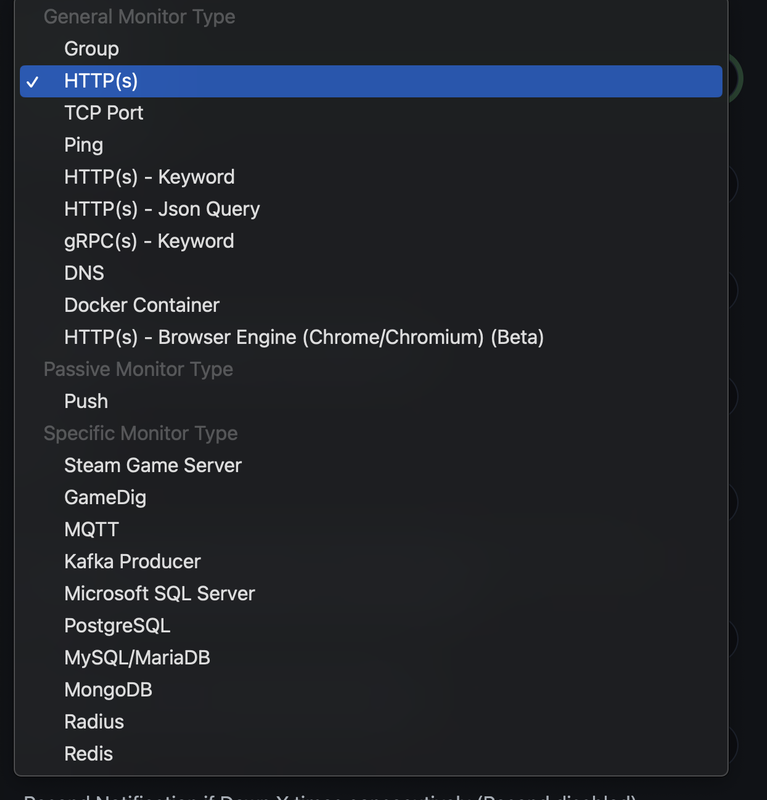
In General section choose a Monitor Type as per requirement.
Provide the website URL you want to monitor.
Set the frequency of checking the status of the website.
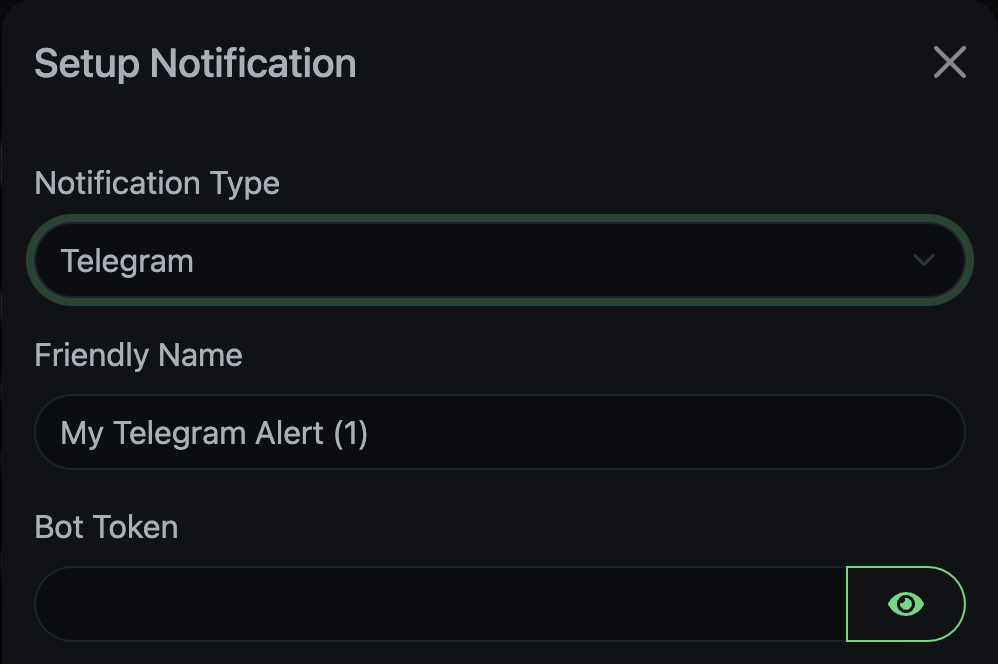
You can also setup the notification type and channel on which you want the notifications.
After setting up the monitor configuration click Save at the bottom of the page.
Now the monitor will be available on your Uptime Kuma Dashboard.
You will also be able to receive notifications depending on the type of monitor you configured for example if the specified website service is down you will be notified on the notification channel you setup.
Conclusion
In this article, you deployed Vultr's Uptime Kuma Marketplace Application. You explored its user friendly dashboard, created a monitor and setup notifications to know the status of a website. With pre-installed Marketplace Application on a Vultr server developers can save hours of setup time and focus on actual application development.