How to Deploy Uptime Kuma - Self-Hosted Status Page and Monitoring Tool
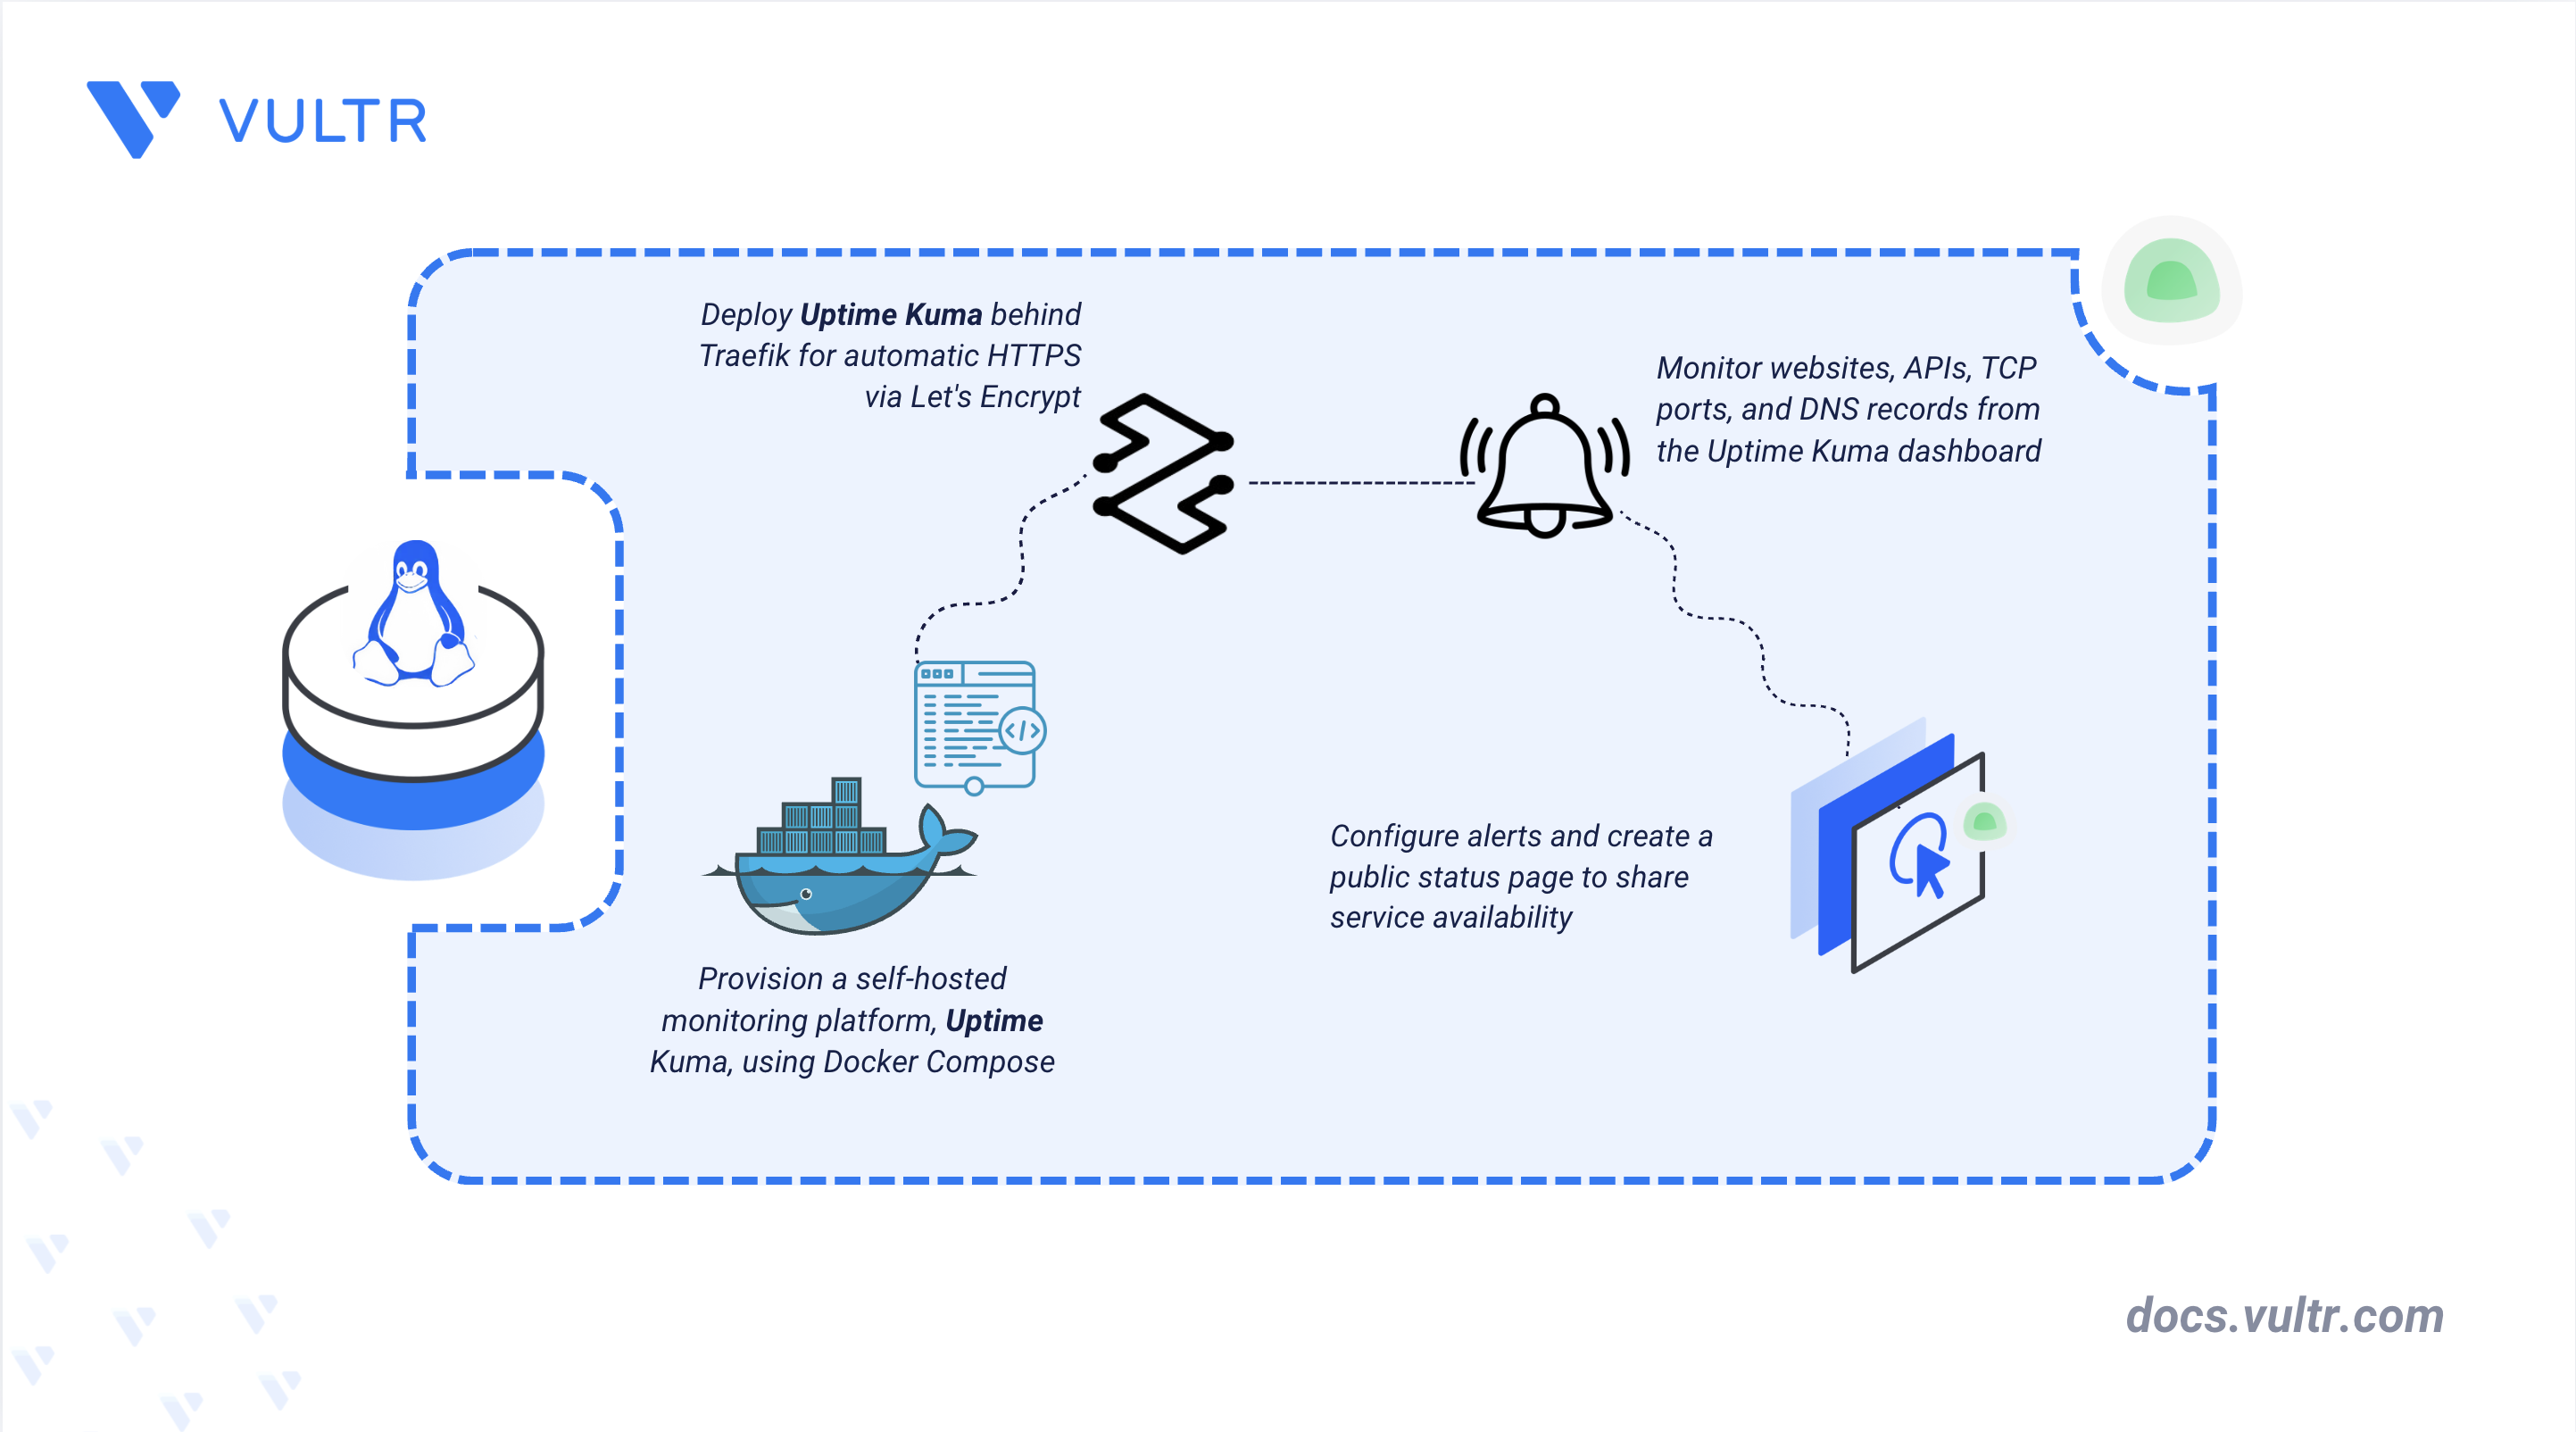
Uptime Kuma is a self-hosted monitoring tool that tracks the availability of websites, APIs, TCP ports, DNS records, and other services. It provides a clean dashboard to display uptime metrics and trigger alerts through 90+ notification services, including email, Slack, and Telegram, when a service goes down or recovers.
This article explains how to deploy Uptime Kuma on a Linux server using Docker Compose behind a Traefik reverse proxy.
Prerequisites
Before you begin, you need to:
- Have access to a Linux-based server as a non-root user with sudo privileges.
- Install Docker and Docker Compose.
- Configure a domain A record, such as
kuma.example.com, pointing to your server's public IP address. - Add your user to the
dockergroup to run Docker commands withoutsudo, then start a new shell session to apply the change.
Set Up the Directory Structure and Environment Variables
The project directory holds the Docker Compose file, the persistent data directory, and the environment variables shared between the Traefik and Uptime Kuma containers.
Create the project directory.
CONSOLENavigate to the project directory.
CONSOLECreate the persistent data directory for Uptime Kuma.
CONSOLECreate the environment variable file.
CONSOLEAdd the following variables to the file.
INIReplace the following placeholders:
kuma.example.com: Your registered domain name pointing to the server's IP address.admin@example.com: Your email address for Let's Encrypt certificate notifications.
Save and close the file.
Deploy with Docker Compose
Traefik and Uptime Kuma run as separate containers on a shared Docker network. Traefik terminates TLS on the configured domain and forwards requests to Uptime Kuma's internal port, keeping Uptime Kuma off the public internet entirely.
Create the Docker Compose file.
CONSOLEAdd the following configuration.
YAMLSave and close the file.
This file defines:
traefik: The reverse proxy that listens on ports80and443, redirects all HTTP traffic to HTTPS, and automatically provisions TLS certificates from Let's Encrypt using the HTTP challenge method.uptime-kuma: The monitoring service that stores data in the./datadirectory. The Traefik labels configure domain routing, enable HTTPS, and forward traffic to the Uptime Kuma application on port3001.kuma-net: A shared bridge network that allows Traefik and Uptime Kuma to communicate internally without exposing internal ports to the host.
Start all services in detached mode.
CONSOLEVerify that all containers are running.
CONSOLEThe output displays two running containers: Traefik and Uptime Kuma.
Configure Uptime Kuma
Uptime Kuma does not report any status information until you create an administrator account and configure at least one monitor.
Open a web browser and navigate to the domain configured in the
.envfile.On the database setup page, select SQLite, then click Next. SQLite requires no additional configuration and works with the single-container deployment in this article. The MariaDB/MySQL option connects to a separate database server that this deployment does not provision.
The account creation page appears. Enter a username and a strong password in both the Password and Repeat Password fields, then click Create.
After you create the account, the Uptime Kuma dashboard opens. Click + Add New Monitor.
Configure the monitor settings:
- Monitor Type: Select the type of service to monitor. Choose HTTP(s) for websites and APIs, TCP Port for port-based services, or DNS for domain records.
- Friendly Name: Enter a descriptive name for the monitor (for example,
My Website). - URL: Enter the full URL of the service to monitor (for example,
https://example.com). - Heartbeat Interval: Set the polling frequency in seconds. The default is
60.
Click Save to activate the monitor. The dashboard adds the monitor with an Unknown status. The status updates to Up or Down after the first heartbeat check runs within 60 seconds.
Configure Alert Notifications
Uptime Kuma does not send alerts by default. You must configure a notification channel and assign it to individual monitors before it triggers on a status change.
Click the profile avatar in the top-right corner and select Settings.
Navigate to the Notifications tab and click Set Up Notification.
Select a notification type from the dropdown. Supported channels include email (SMTP), Slack, Telegram, Discord, and PagerDuty, along with more than 90 other services.
Enter the required credentials or webhook URL of the selected notification channel.
Click Test to send a test notification and verify that the configuration is working.
Click Save to confirm the notification setup.
Open the settings for each monitor that uses this notification channel, select the notification from the Notifications list, and click Save.
Create a Status Page
A status page groups one or more monitors into a public view, separate from the administrator dashboard, so you can share it with users or team members without granting them access to the full Uptime Kuma interface.
Click Status Pages in the top navigation bar.
Click New Status Page.
Enter a Name for the status page (for example,
Service Status), then enter a Slug using only lowercase letters, numbers, and hyphens (for example,statuscreates the URLhttps://kuma.example.com/status/status). Click Next.The status page editor opens. The Title field is pre-filled with the name entered in the previous step. Add a Description if needed, then configure the remaining display settings as needed.
Click Add Group to create a section, then use the Add a monitor dropdown to select a monitor and add it to the group.
Click Save to publish the status page.
Open the status page URL in a browser to verify it loads and displays the monitor statuses.
Replace the path with the slug configured in step 3.
Conclusion
You have deployed Uptime Kuma on a Linux server using Docker Compose with Traefik providing TLS termination, and configured a monitor, a notification channel, and a public status page. For more information, see the Uptime Kuma documentation.
Tags:Open Source


0 Comments
Be the first to comment and share your perspective with the community.