
How to Enable Observability in NVIDIA Dynamo Inference Pipelines
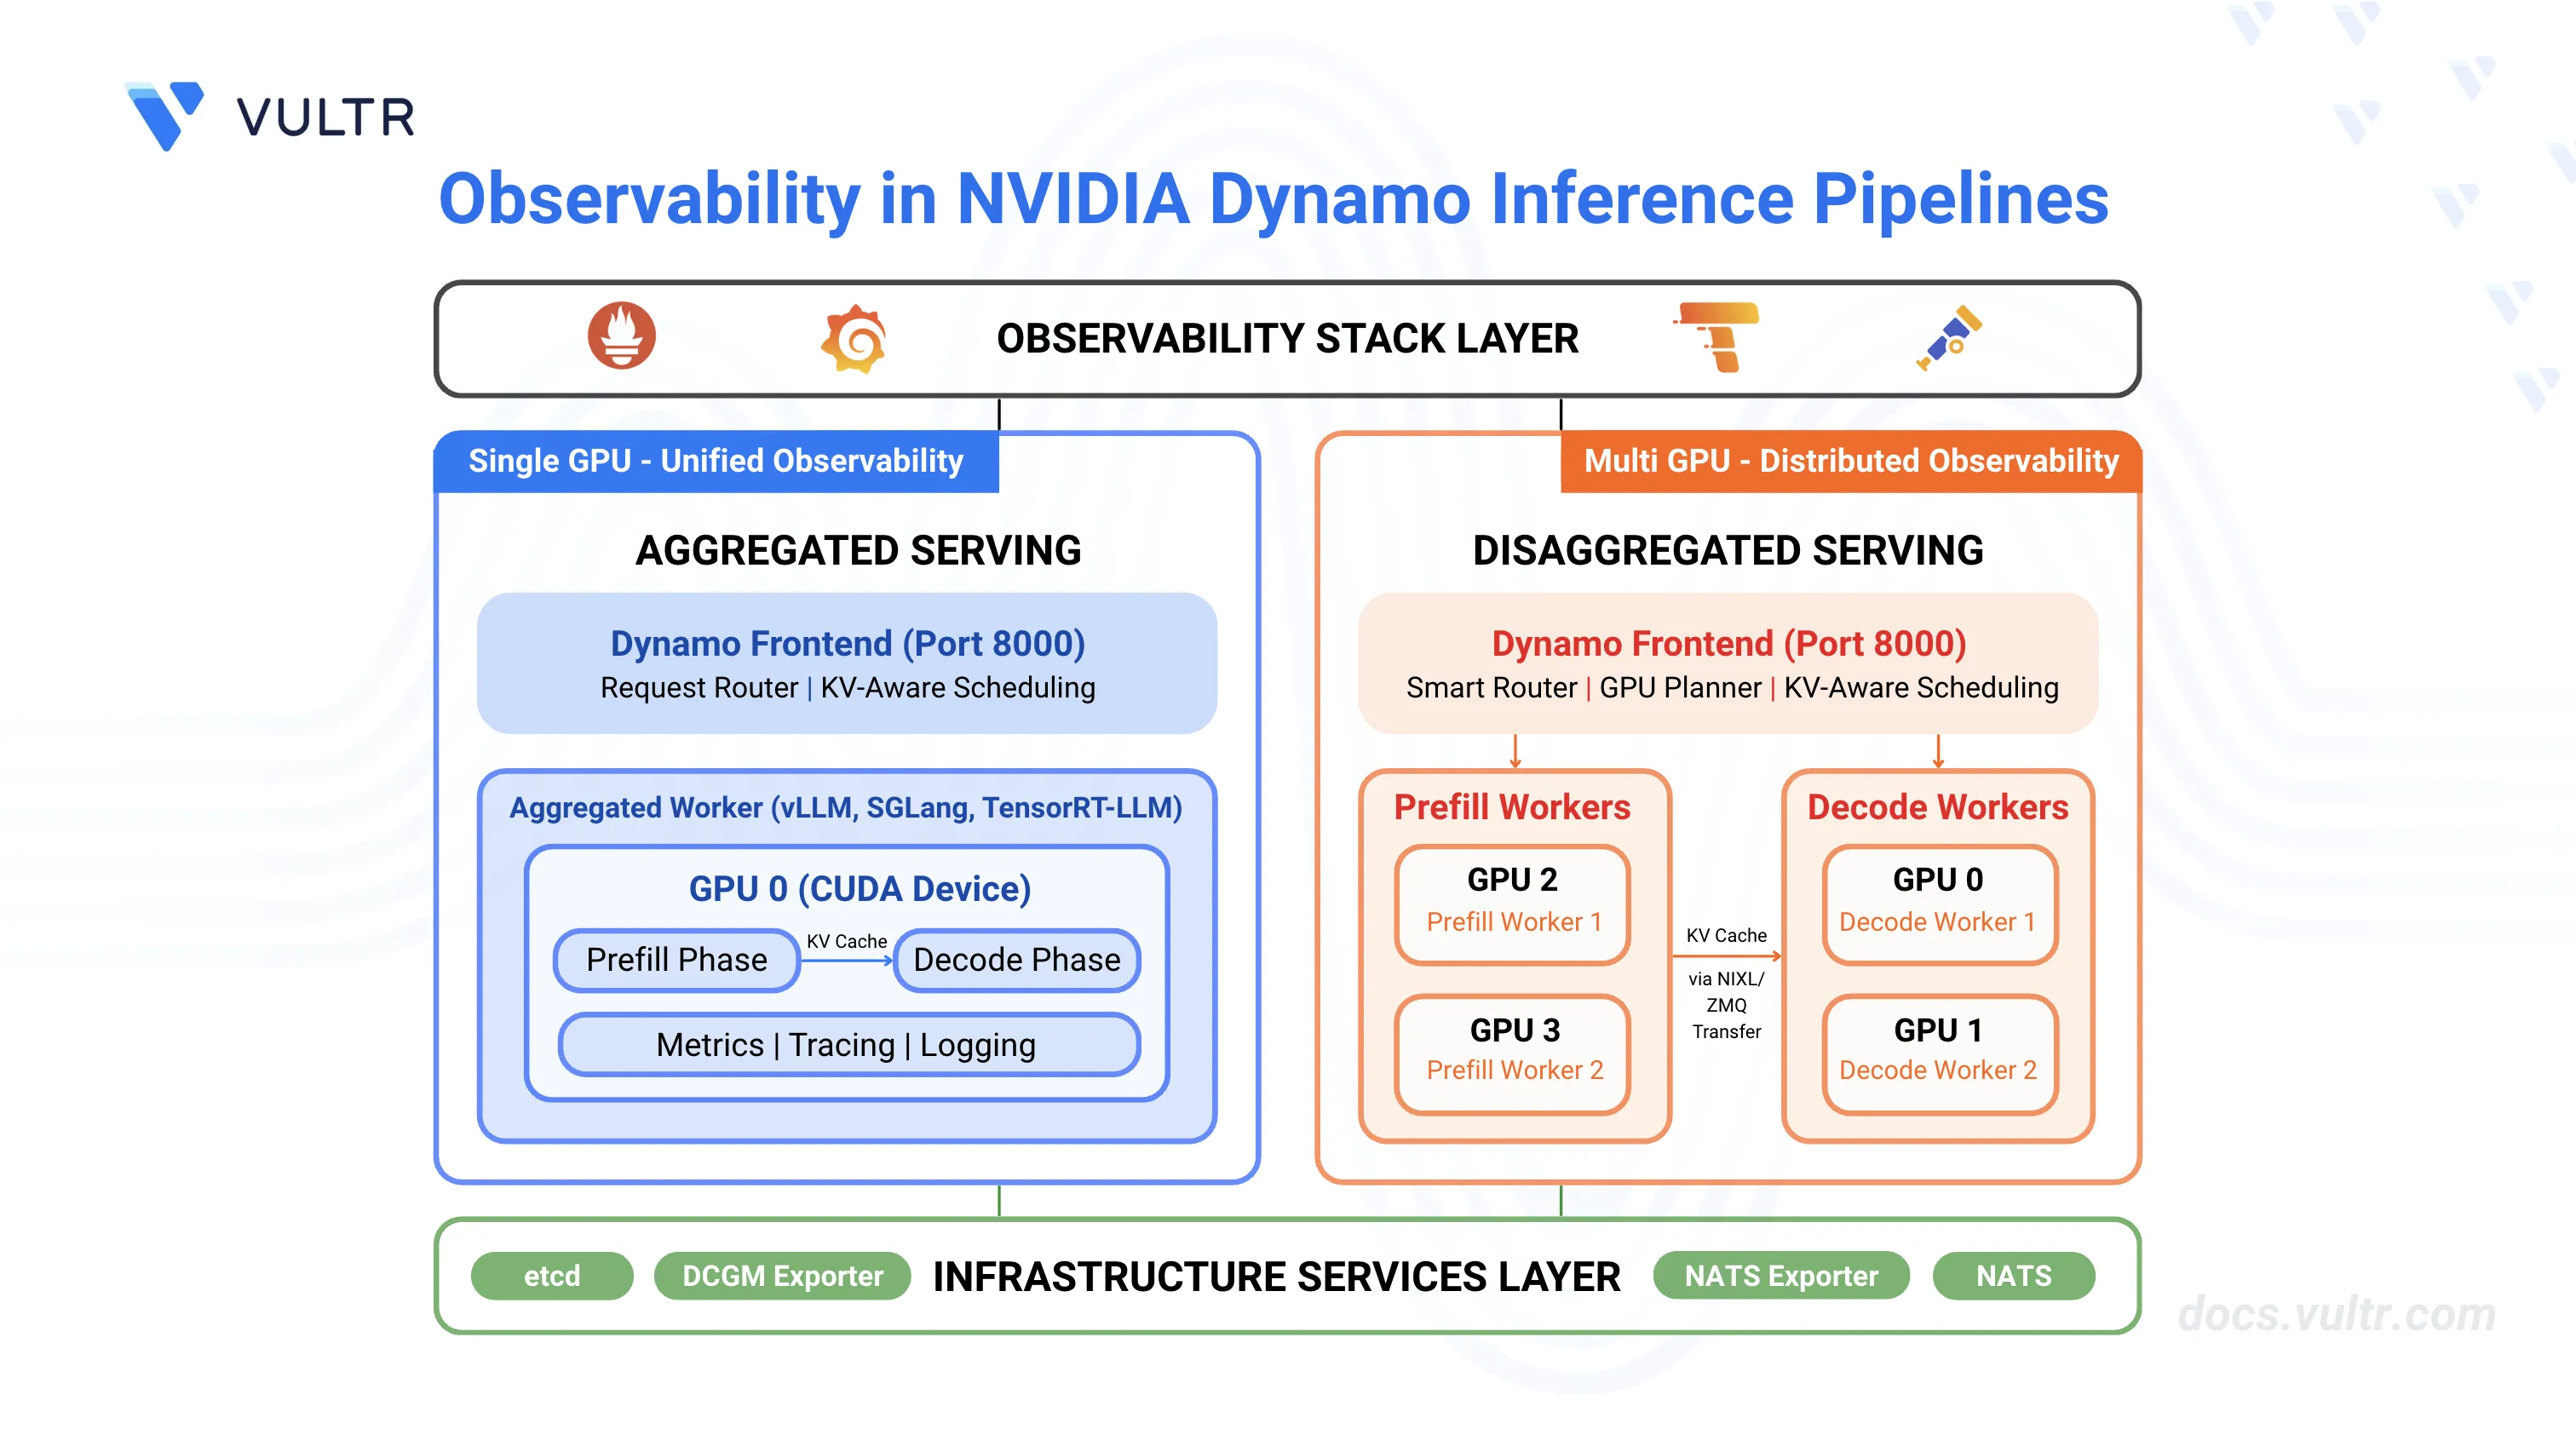
NVIDIA Dynamo is an open-source inference framework for deploying large-scale generative AI models across multi-node, multi-GPU environments. Distributed inference systems require comprehensive observability to track request flows, monitor resource utilization, and troubleshoot failures across multiple workers. Dynamo provides built-in observability through metrics (Prometheus), distributed tracing (OpenTelemetry/Tempo), and structured logging.
This guide covers enabling and configuring observability in NVIDIA Dynamo inference pipelines for both aggregated serving (single-worker) and disaggregated serving (separate prefill/decode workers), providing visibility into request latency, token throughput, KV cache performance, and system health.
Prerequisites
Before you begin, ensure you:
- Have access to a Linux server with NVIDIA GPUs installed and the NVIDIA Container Toolkit configured. Use a non-root user with sudo privileges.
- 1 GPU minimum for aggregated serving.
- 4 GPUs for disaggregated serving.
- Install Docker Engine and Docker Compose.
- Create a Hugging Face account and generate an access token for gated models like Llama.
Understanding NVIDIA Dynamo Observability
Observability in NVIDIA Dynamo provides comprehensive monitoring capabilities through three interconnected systems that work together to provide visibility into inference pipeline performance and behavior.
Metrics expose quantitative measurements through Prometheus endpoints on each Dynamo component. The frontend service exposes metrics including request counts, token processing rates, time-to-first-token (TTFT), and inter-token latency on port 8000. Backend workers expose component-level metrics including request duration, inflight requests, and KV cache statistics on their system status ports (default: 8081). The metrics system uses the Prometheus exposition format and includes labels (
dynamo_namespace,dynamo_component,dynamo_endpoint) to identify metric sources. All Dynamo-generated metrics use thedynamo_*prefix for consistent identification.Tracing provides distributed request flow visualization using OpenTelemetry and Tempo. When enabled, Dynamo creates trace spans that follow requests across the frontend, prefill workers, and decode workers. Each trace includes a root
http-requestspan from the frontend, aprefill_routingspan for routing decisions, andhandle_payloadspans for prefill and decode operations. Traces use OpenTelemetry Protocol (OTLP) to export data to Tempo, where Grafana displays flame graphs showing request timelines, component interactions, and processing durations. Traces include correlation IDs through thex-request-idheader, enabling request tracking across distributed components.Logging captures structured event data in JSONL format with trace context. When JSONL logging is enabled, each log entry includes
trace_id,span_id, andx_request_idfields that correlate logs with traces. The logging system supports configurable verbosity levels (ERROR, WARN, INFO, DEBUG, TRACE) and target-specific filtering. Logs are written to stderr and can be collected by log aggregation systems for centralized analysis.
Clone the Dynamo Repository
NVIDIA Dynamo provides deployment scripts, container utilities, and orchestration modules required to run inference workloads. Clone the repository to access the deployment assets and container runtime scripts.
Clone the repository.
console$ git clone https://github.com/ai-dynamo/dynamo.git
Navigate to the repository directory.
console$ cd dynamo
Switch to the latest stable release.
console$ git checkout release/0.9.0
The command checks out the stable release. Visit the Dynamo releases page to find the latest stable release version.
Start Infrastructure and Observability Services
Dynamo's observability architecture requires both infrastructure components (etcd, NATS) and monitoring services (Prometheus, Grafana, Tempo, exporters). The infrastructure services provide service discovery and message passing, while the observability services collect metrics, store traces, and visualize data. The Docker Compose configurations launch all required services with appropriate port mappings and network connectivity.
Start the infrastructure services.
console$ docker compose -f deploy/docker-compose.yml up -d
Start the observability stack.
console$ docker compose -f deploy/docker-observability.yml up -d
Verify all services are running.
console$ docker compose -f deploy/docker-compose.yml ps && docker compose -f deploy/docker-observability.yml ps
All containers should be up and running with exposed ports for etcd, NATS, Grafana, Prometheus, Tempo, DCGM Exporter, and NATS Exporter.
The services expose monitoring interfaces on the following ports:
- Grafana:
http://SERVER-IP:3000(username:dynamo, password:dynamo) - Prometheus:
http://SERVER-IP:9090 - Tempo:
http://SERVER-IP:3200 - DCGM Exporter:
http://localhost:9401/metrics(GPU metrics) - NATS Exporter:
http://localhost:7777/metrics(NATS messaging metrics)
- Grafana:
Configure Firewall for Metrics Collection
Prometheus (running in Docker) scrapes metrics from worker endpoints running on the host machine. If a firewall is enabled, allow the worker and frontend ports for successful metrics collection.
Allow metrics ports through the firewall.
console$ sudo ufw allow 8000/tcp # Frontend API and metrics $ sudo ufw allow 8081:8084/tcp # Worker metrics ports
Verify the firewall rules.
console$ sudo ufw status
The output displays the active firewall rules with allowed ports.
Verify CUDA Version and Pull Container Image
The vLLM container requires a CUDA version match between the host driver and container runtime to prevent GPU kernel incompatibilities. The NVIDIA Container Toolkit maps host GPUs into containers, requiring the container's CUDA version to align with the host driver's supported version.
Check the installed CUDA version.
console$ nvidia-smiThe output displays the CUDA version in the top-right corner of the table:
+-----------------------------------------------------------------------------------------+
| NVIDIA-SMI 580.95.05              Driver Version: 580.95.05      CUDA Version: 13.0     |
+-----------------------------------------+------------------------+----------------------+
....
Pull the vLLM container image from NGC. Match the CUDA version in the image tag to your system's CUDA version.
For CUDA 13.x, use:
console$ docker pull nvcr.io/nvidia/ai-dynamo/vllm-runtime:0.9.0-cuda13
For CUDA 12.x, use:
console$ docker pull nvcr.io/nvidia/ai-dynamo/vllm-runtime:0.9.0
Visit the NVIDIA NGC Catalog to view all available image tags and CUDA versions.
This guide uses vLLM for examples, but observability features work with all supported backends (vLLM, SGLang, TensorRT-LLM). You can use observability settings with any backend by following the same configuration pattern. For backend-specific deployment steps, refer to How to Deploy Inference Using NVIDIA Dynamo and vLLM, How to Deploy Inference Using NVIDIA Dynamo and SGLang, and How to Deploy Inference Using NVIDIA Dynamo and TensorRT-LLM.Note
Configure Hugging Face Cache Permissions
The container runs as UID 1000 and requires write access to the Hugging Face cache directory for model downloads. Incorrect permissions prevent the container from accessing cached model weights, causing worker initialization failures.
Create the cache directory if it does not exist.
console$ mkdir -p container/.cache/huggingface
Set ownership to the container user (UID 1000).
console$ sudo chown -R 1000:1000 container/.cache/huggingface
Set appropriate permissions.
console$ sudo chmod -R 775 container/.cache/huggingface
Configure Environment Variables for Observability
NVIDIA Dynamo uses environment variables to control observability features across metrics, tracing, and logging systems. The following table describes the key environment variables for observability configuration.
Environment Variable Descriptions:
| Variable | Description | Default | Impact |
|---|---|---|---|
DYN_LOGGING_JSONL |
Enable structured JSONL logging with trace context | false |
Required for trace correlation in logs |
DYN_LOG |
Log level configuration (error, warn, info, debug, trace) |
info |
Controls log verbosity |
DYN_LOG_USE_LOCAL_TZ |
Use local timezone instead of UTC for log timestamps | false |
Timestamp formatting |
OTEL_EXPORT_ENABLED |
Enable OTLP trace export to Tempo | false |
Required for trace visualization |
OTEL_EXPORTER_OTLP_TRACES_ENDPOINT |
OTLP gRPC endpoint for Tempo | http://localhost:4317 |
Trace export destination |
OTEL_SERVICE_NAME |
Service name for component identification in traces | dynamo |
Component labeling in traces |
DYN_SYSTEM_PORT |
Backend worker system port for metrics and health checks | -1 (disabled) |
Metrics endpoint port |
DYN_HTTP_PORT |
Frontend HTTP port for API and metrics | 8000 |
Frontend metrics port |
Setup Container and Observability Environment
The container environment setup and observability configuration are common to both aggregated and disaggregated deployments. Complete these steps once before deploying either configuration.
Export your Hugging Face token to avoid rate limitations when downloading large models. Replace
YOUR_HF_TOKENwith your actual token.console$ export HF_TOKEN=YOUR_HF_TOKEN
Run the vLLM container with GPU access and workspace mounting. Use the image tag that matches your CUDA version from the previous section.
console$ ./container/run.sh -it --framework VLLM --mount-workspace --image nvcr.io/nvidia/ai-dynamo/vllm-runtime:0.9.0-cuda13 -e HF_TOKEN=$HF_TOKEN
The command starts an interactive container session with GPU support and passes the Hugging Face token to the container.
Inside the container, create an observability environment configuration file.
console$ cat << 'EOF' > ~/observability.env # Logging Configuration export DYN_LOGGING_JSONL=true export DYN_LOG=info # Tracing Configuration export OTEL_EXPORT_ENABLED=true export OTEL_EXPORTER_OTLP_TRACES_ENDPOINT=http://localhost:4317 EOF
This environment file contains the observability configuration that will be sourced by both aggregated and disaggregated deployment scripts.
Deploy Aggregated Serving with Observability
Aggregated serving runs both prefill and decode operations on a single worker, simplifying deployment while maintaining full observability capabilities. This configuration suits single-GPU setups or development environments.
Create a launch script for aggregated serving with observability enabled.
console$ cat << 'EOF' > ~/aggregated_obs.sh #!/bin/bash set -e trap 'echo Cleaning up...; kill 0' EXIT # Set deterministic hash for KV event IDs export PYTHONHASHSEED=0 # Model configuration - use command line argument or default MODEL="${1:-nvidia/Llama-3.1-Nemotron-Nano-4B-v1.1}" # Source observability environment variables source ~/observability.env echo "Starting Dynamo Frontend with observability..." export OTEL_SERVICE_NAME=dynamo-frontend DYN_HTTP_PORT=${DYN_HTTP_PORT:-8000} python -m dynamo.frontend & echo "Starting vLLM Worker with model: $MODEL" export OTEL_SERVICE_NAME=dynamo-worker-aggregated DYN_SYSTEM_PORT=${DYN_SYSTEM_PORT:-8081} \ CUDA_VISIBLE_DEVICES=0 python -m dynamo.vllm \ --model "$MODEL" \ --trust-remote-code \ --enforce-eager \ --connector none \ --otlp-traces-endpoint="$OTEL_EXPORTER_OTLP_TRACES_ENDPOINT" & echo "Waiting for services to initialize..." sleep 30 echo "" echo "Aggregated deployment ready with observability enabled!" echo "Model: $MODEL" echo "" echo "API Endpoint:" echo " http://localhost:8000/v1/chat/completions" echo "" echo "Metrics Endpoints:" echo " Frontend: http://localhost:8000/metrics" echo " Worker: http://localhost:8081/metrics" echo "" echo "Observability UIs:" echo " Grafana: http://localhost:3000 (username: dynamo, password: dynamo)" echo " Prometheus: http://localhost:9090" echo " Tempo: http://localhost:3200" echo "" # Keep script running wait EOF
The script configures the following observability components:
- Environment Variables: Sources
observability.envto enable JSON logging (DYN_LOGGING_JSONL=true) and OpenTelemetry trace export (OTEL_EXPORT_ENABLED=true). - Service Names: Sets unique
OTEL_SERVICE_NAMEfor the frontend (dynamo-frontend) and worker (dynamo-worker-aggregated) to identify components in traces. - Metrics Endpoints: Exposes metrics on port 8000 (frontend via
DYN_HTTP_PORT) and port 8081 (worker viaDYN_SYSTEM_PORT). - Trace Export: Configures the worker with
--otlp-traces-endpointto send trace spans to Tempo athttp://localhost:4317. - Request Correlation: Uses
PYTHONHASHSEED=0to ensure consistent KV event ID generation across requests for trace correlation.
- Environment Variables: Sources
Make the script executable.
console$ chmod +x ~/aggregated_obs.sh
Run the deployment script.
console$ ~/aggregated_obs.shThe output displays initialization messages and endpoint URLs:
Starting NVIDIA Dynamo Frontend with observability...
Starting Aggregated vLLM Worker with observability...
Waiting for services to initialize...
......
Aggregated deployment ready with observability enabled!
Model: nvidia/Llama-3.1-Nemotron-Nano-4B-v1.1

API Endpoint:
  http://localhost:8000/v1/chat/completions

Metrics Endpoints:
  Frontend: http://localhost:8000/metrics
  Worker: http://localhost:8081/metrics

Observability UIs:
  Grafana: http://localhost:3000 (username: dynamo, password: dynamo)
  Prometheus: http://localhost:9090
  Tempo: http://localhost:3200
Open a new terminal session on your server (outside the container).
Test with a chat completion request.
console$ curl -X POST http://localhost:8000/v1/chat/completions \ -H "Content-Type: application/json" \ -d '{ "model": "nvidia/Llama-3.1-Nemotron-Nano-4B-v1.1", "messages": [{"role": "user", "content": "Hello! Tell me about AI."}], "max_tokens": 100 }'
The output displays the model's chat response in JSON format.
Verify Aggregated Deployment Observability
Verification confirms that metrics, tracing, and logging systems are functioning correctly by checking endpoints and generating test requests.
Verify metrics are exposed. Open a new terminal session.
console$ curl -s http://localhost:8000/metrics | grep dynamo_frontend_requests_total
The output displays the frontend request counter metric:
# HELP dynamo_frontend_requests_total Total number of LLM requests processed
# TYPE dynamo_frontend_requests_total counter
dynamo_frontend_requests_total{endpoint="chat_completions",model="nvidia/llama-3.1-nemotron-nano-4b-v1.1",request_type="unary",status="success"} 1
Verify worker metrics are exposed.
console$ curl -s http://localhost:8081/metrics | grep dynamo_component_uptime_seconds
The output displays the worker uptime metric:
# HELP dynamo_component_uptime_seconds Total uptime of the DistributedRuntime in seconds
# TYPE dynamo_component_uptime_seconds gauge
dynamo_component_uptime_seconds 234.966756758
Send a test inference request with a custom request ID for trace correlation.
console$ curl -X POST http://localhost:8000/v1/chat/completions \ -H 'Content-Type: application/json' \ -H 'x-request-id: test-aggregated-001' \ -d '{ "model": "nvidia/Llama-3.1-Nemotron-Nano-4B-v1.1", "max_completion_tokens": 50, "messages": [ {"role": "user", "content": "Explain what observability means in distributed systems."} ] }'
The output returns the generated response.
Check updated metrics after the request.
console$ curl -s http://localhost:8000/metrics | grep dynamo_frontend_requests_total
The counter increments to reflect the processed request.
dynamo_frontend_requests_total{endpoint="chat_completions",model="nvidia/llama-3.1-nemotron-nano-4b-v1.1",request_type="unary",status="success"} 2
View Traces in Tempo
Access Grafana to view the trace. Open
http://SERVER-IP:3000in a web browser and login with usernamedynamoand passworddynamo.Navigate to Explore (compass icon in the left sidebar).
Select Tempo as the data source (should be selected by default).
In the query type selector, choose Search.
Use the Search tab to find traces by configuring the following options:
- Service Name: Select a service (e.g.,
dynamo-frontend,dynamo-worker-aggregated) - Span Name: Select a span (e.g.,
http-request,handle_payload) - Tags: Add tag
x_request_idwith valuetest-aggregated-001
- Service Name: Select a service (e.g.,
Click Run query to execute the search.
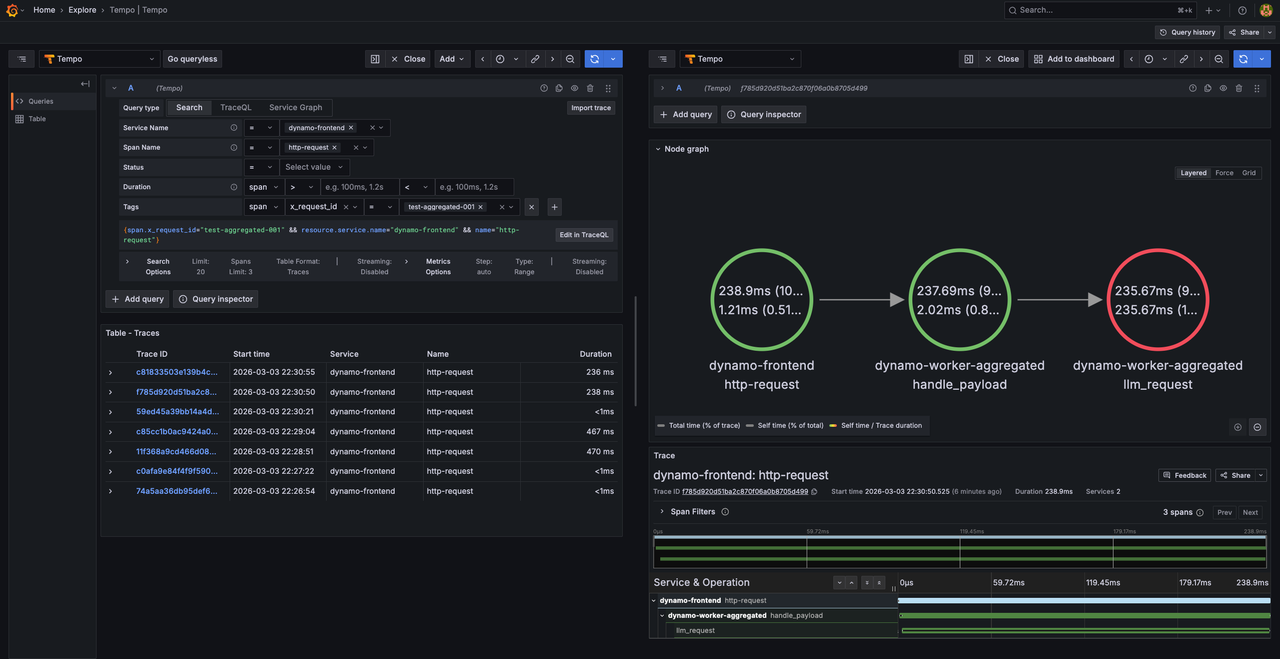
Click on the displayed trace to view the detailed flame graph showing the request flow through the frontend and worker components, including timing information for each span.
View Aggregated Metrics Dashboard
Navigate to Dashboards.
Click on Dynamo Dashboard to open the main metrics dashboard.
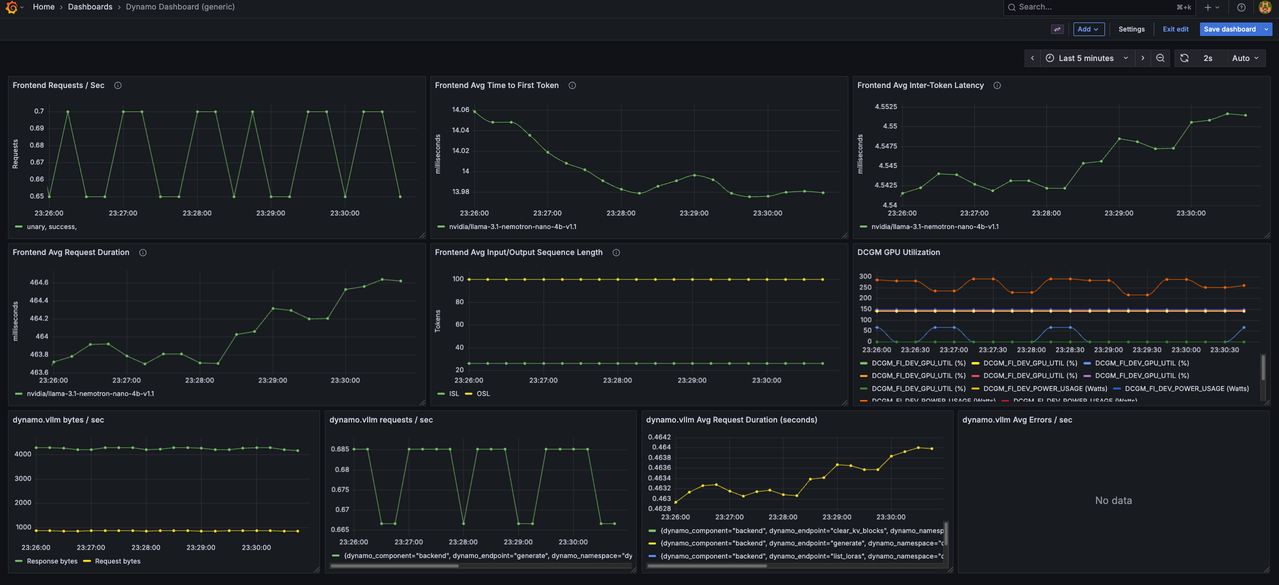
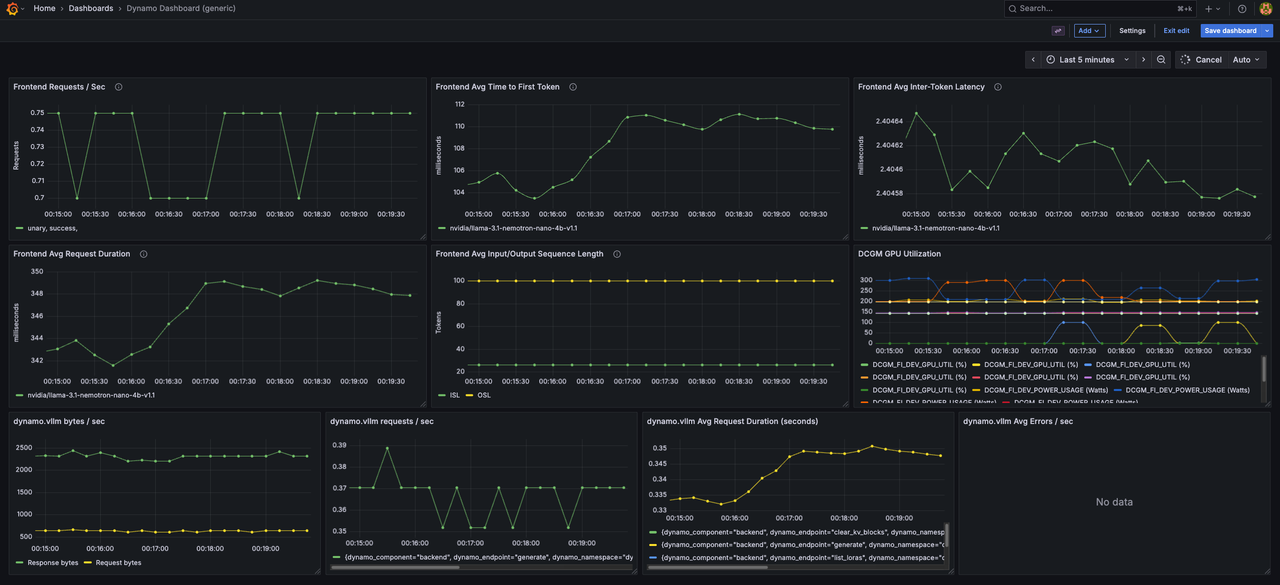
The Dynamo Dashboard displays real-time metrics including:
- Frontend request rate and latency
- Worker token generation throughput
- KV cache statistics (active blocks, total blocks, GPU cache usage)
- Component uptime and health status
Use the time range selector in the top-right corner to adjust the viewing window (Last 5 minutes, Last 15 minutes, etc.).
Deploy Disaggregated Serving with Observability
Disaggregated serving separates prefill and decode operations across different workers, enabling independent scaling and optimization of each phase. This configuration requires multiple GPUs and provides detailed observability into each pipeline stage.
Create the disaggregated deployment script.
console$ cat << 'EOF' > ~/disaggregated_obs.sh #!/bin/bash # Source observability environment variables source ~/observability.env # Kill any existing Dynamo processes pkill -f "dynamo.frontend" pkill -f "dynamo.vllm" sleep 2 # Set deterministic hash for KV event IDs export PYTHONHASHSEED=0 # Model configuration - use command line argument or default MODEL="${1:-nvidia/Llama-3.1-Nemotron-Nano-4B-v1.1}" echo "Starting NVIDIA Dynamo Frontend with observability..." export OTEL_SERVICE_NAME=dynamo-frontend DYN_HTTP_PORT=${DYN_HTTP_PORT:-8000} python -m dynamo.frontend & echo "Starting Decode Workers with observability..." echo "Model: $MODEL" # Decode Worker 1 - GPU 0 export OTEL_SERVICE_NAME=dynamo-worker-decode-1 DYN_SYSTEM_PORT=${DYN_SYSTEM_PORT:-8081} \ CUDA_VISIBLE_DEVICES=0 python -m dynamo.vllm \ --model "$MODEL" \ --trust-remote-code \ --is-decode-worker \ --max-model-len 2048 \ --otlp-traces-endpoint="$OTEL_EXPORTER_OTLP_TRACES_ENDPOINT" & # Decode Worker 2 - GPU 1 export OTEL_SERVICE_NAME=dynamo-worker-decode-2 DYN_SYSTEM_PORT=8082 \ VLLM_NIXL_SIDE_CHANNEL_PORT=20097 \ CUDA_VISIBLE_DEVICES=1 python -m dynamo.vllm \ --model "$MODEL" \ --trust-remote-code \ --is-decode-worker \ --max-model-len 2048 \ --otlp-traces-endpoint="$OTEL_EXPORTER_OTLP_TRACES_ENDPOINT" & echo "Starting Prefill Workers with observability..." # Prefill Worker 1 - GPU 2 export OTEL_SERVICE_NAME=dynamo-worker-prefill-1 DYN_SYSTEM_PORT=8083 \ DYN_VLLM_KV_EVENT_PORT=20082 \ CUDA_VISIBLE_DEVICES=2 python -m dynamo.vllm \ --model "$MODEL" \ --trust-remote-code \ --is-prefill-worker \ --max-model-len 2048 \ --otlp-traces-endpoint="$OTEL_EXPORTER_OTLP_TRACES_ENDPOINT" \ --kv-events-config '{"publisher":"zmq","topic":"kv-events","endpoint":"tcp://*:20082","enable_kv_cache_events":true}' & # Prefill Worker 2 - GPU 3 export OTEL_SERVICE_NAME=dynamo-worker-prefill-2 DYN_SYSTEM_PORT=8084 \ DYN_VLLM_KV_EVENT_PORT=20083 \ VLLM_NIXL_SIDE_CHANNEL_PORT=20099 \ CUDA_VISIBLE_DEVICES=3 python -m dynamo.vllm \ --model "$MODEL" \ --trust-remote-code \ --is-prefill-worker \ --max-model-len 2048 \ --otlp-traces-endpoint="$OTEL_EXPORTER_OTLP_TRACES_ENDPOINT" \ --kv-events-config '{"publisher":"zmq","topic":"kv-events","endpoint":"tcp://*:20083","enable_kv_cache_events":true}' & echo "Waiting for services to initialize..." sleep 30 echo "" echo "Disaggregated deployment ready with observability enabled!" echo "Model: $MODEL" echo "" echo "API Endpoint:" echo " http://localhost:8000/v1/chat/completions" echo "" echo "Metrics Endpoints:" echo " Frontend: http://localhost:8000/metrics" echo " Decode Worker 1: http://localhost:8081/metrics" echo " Decode Worker 2: http://localhost:8082/metrics" echo " Prefill Worker 1: http://localhost:8083/metrics" echo " Prefill Worker 2: http://localhost:8084/metrics" echo "" echo "Observability UIs:" echo " Grafana: http://localhost:3000 (username: dynamo, password: dynamo)" echo " Prometheus: http://localhost:9090" echo " Tempo: http://localhost:3200" echo "" # Keep script running wait EOF
The script configures disaggregated observability with the following components:
- Service Separation: Deploys 4 workers with unique
OTEL_SERVICE_NAMEidentifiers (dynamo-worker-decode-1,dynamo-worker-decode-2,dynamo-worker-prefill-1,dynamo-worker-prefill-2) for trace differentiation. - GPU Allocation: Assigns workers to specific GPUs using
CUDA_VISIBLE_DEVICES(decode workers on GPUs 0-1, prefill workers on GPUs 2-3). - Metrics Endpoints: Exposes metrics on separate ports for each worker (
DYN_SYSTEM_PORT=8081-8084) to enable per-worker monitoring. - Trace Export: Configures all workers with
--otlp-traces-endpointto send trace spans to Tempo, enabling end-to-end request flow visualization across prefill and decode stages. - KV Cache Events: Enables KV cache event publishing on prefill workers using
--kv-events-configwith ZMQ endpoints (ports 20082-20083) for router optimization. - NIXL Communication: Configures side channel ports (
VLLM_NIXL_SIDE_CHANNEL_PORT) for inter-worker KV cache transfer between prefill and decode workers.
- Service Separation: Deploys 4 workers with unique
Make the script executable.
console$ chmod +x ~/disaggregated_obs.sh
Run the deployment script.
console$ ~/disaggregated_obs.shThe output displays initialization messages and endpoint URLs for all components:
Starting NVIDIA Dynamo Frontend with observability...
Starting Decode Workers with observability...
Starting Prefill Workers with observability...
Waiting for services to initialize...

Disaggregated deployment ready with observability enabled!

API Endpoint:
  http://localhost:8000/v1/chat/completions

Metrics Endpoints:
  Frontend: http://localhost:8000/metrics
  Decode Worker 1: http://localhost:8081/metrics
  Decode Worker 2: http://localhost:8082/metrics
  Prefill Worker 1: http://localhost:8083/metrics
  Prefill Worker 2: http://localhost:8084/metrics

Observability UIs:
  Grafana: http://localhost:3000 (username: dynamo, password: dynamo)
  Prometheus: http://localhost:9090
  Tempo: http://localhost:3200
Verify Disaggregated Deployment Observability
Verification confirms that all workers expose metrics independently and traces capture the full request flow across prefill and decode stages.
Verify all worker metrics endpoints are accessible. Open a new terminal session.
console$ for port in 8081 8082 8083 8084; do echo "=== Port $port ===" && curl -s http://localhost:$port/metrics | head -5; done
The output displays metrics from each worker.
Send a test inference request with a custom request ID.
console$ curl -X POST http://localhost:8000/v1/chat/completions \ -H 'Content-Type: application/json' \ -H 'x-request-id: test-disaggregated-001' \ -d '{ "model": "nvidia/Llama-3.1-Nemotron-Nano-4B-v1.1", "max_completion_tokens": 100, "messages": [ {"role": "user", "content": "Describe the benefits of disaggregated serving in LLM inference."} ] }'
The output returns the generated response after processing through separate prefill and decode workers.
Check KV computed tokens statistics from a prefill worker.
console$ curl -s http://localhost:8083/metrics | grep request_prefill_kv_computed_tokens_created
The output displays KV cache metrics including active blocks, total blocks, and cache usage percentage:
# HELP vllm:request_prefill_kv_computed_tokens_created Histogram of new KV tokens computed during prefill (excluding cached tokens).
# TYPE vllm:request_prefill_kv_computed_tokens_created gauge
vllm:request_prefill_kv_computed_tokens_created{engine="0",model_name="nvidia/Llama-3.1-Nemotron-Nano-4B-v1.1"} 1.7725614597782164e+09
View Traces in Tempo
Access Grafana at
http://SERVER-IP:3000and navigate to Explore.Select Tempo as the data source.
In the query type selector, choose Search.
Use the Search tab to find traces by configuring the following options:
- Service Name: Select a service (e.g.,
dynamo-frontend,dynamo-worker-prefill-1,dynamo-worker-decode-1) - Span Name: Select a span (e.g.,
http-request,prefill_routing,handle_payload) - Tags: Add tag
x_request_idwith valuetest-disaggregated-001
- Service Name: Select a service (e.g.,
Click Run query to execute the search.
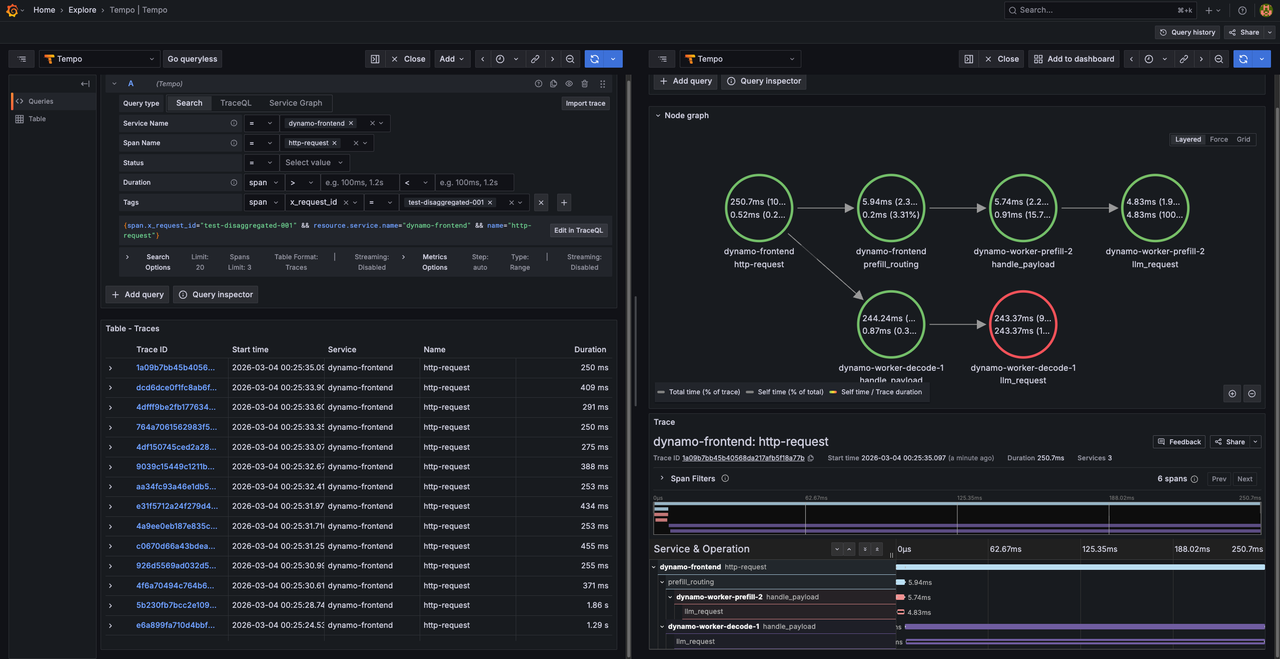
Click on the displayed trace to view the detailed flame graph. Verify the trace includes separate spans for:
- http-request (frontend root span)
- prefill_routing (frontend routing span)
- handle_payload (prefill worker span)
- handle_payload (decode worker span)
The span hierarchy displays the request flow from the frontend through prefill to decode operations with timing information for each pipeline stage.
View Disaggregated Metrics Dashboard
Navigate to Dashboards (four squares icon in the left sidebar).
Click on Dynamo Dashboard to open the main metrics dashboard.
The Dynamo Dashboard displays real-time metrics from all workers including:
- Frontend request rate and latency
- Per-worker token generation throughput (decode and prefill workers)
- KV cache statistics across all workers
- Disaggregated request flow metrics
- Component uptime and health status
Use the time range selector in the top-right corner to adjust the viewing window and observe metrics from different workers.
Conclusion
You have successfully configured and deployed observability features in NVIDIA Dynamo inference pipelines for both aggregated and disaggregated serving modes. The deployment exposes comprehensive metrics through Prometheus, distributed traces through Tempo, and structured logs with trace correlation. The environment variables (DYN_LOGGING_JSONL, OTEL_EXPORT_ENABLED, OTEL_EXPORTER_OTLP_TRACES_ENDPOINT, OTEL_SERVICE_NAME, DYN_SYSTEM_PORT) control observability behavior across all Dynamo components, enabling consistent monitoring and troubleshooting capabilities. For more information about advanced observability configurations, refer to the official NVIDIA Dynamo observability documentation.