How To Install Elasticsearch, Logstash, and Kibana (ELK Stack) on Kubernetes
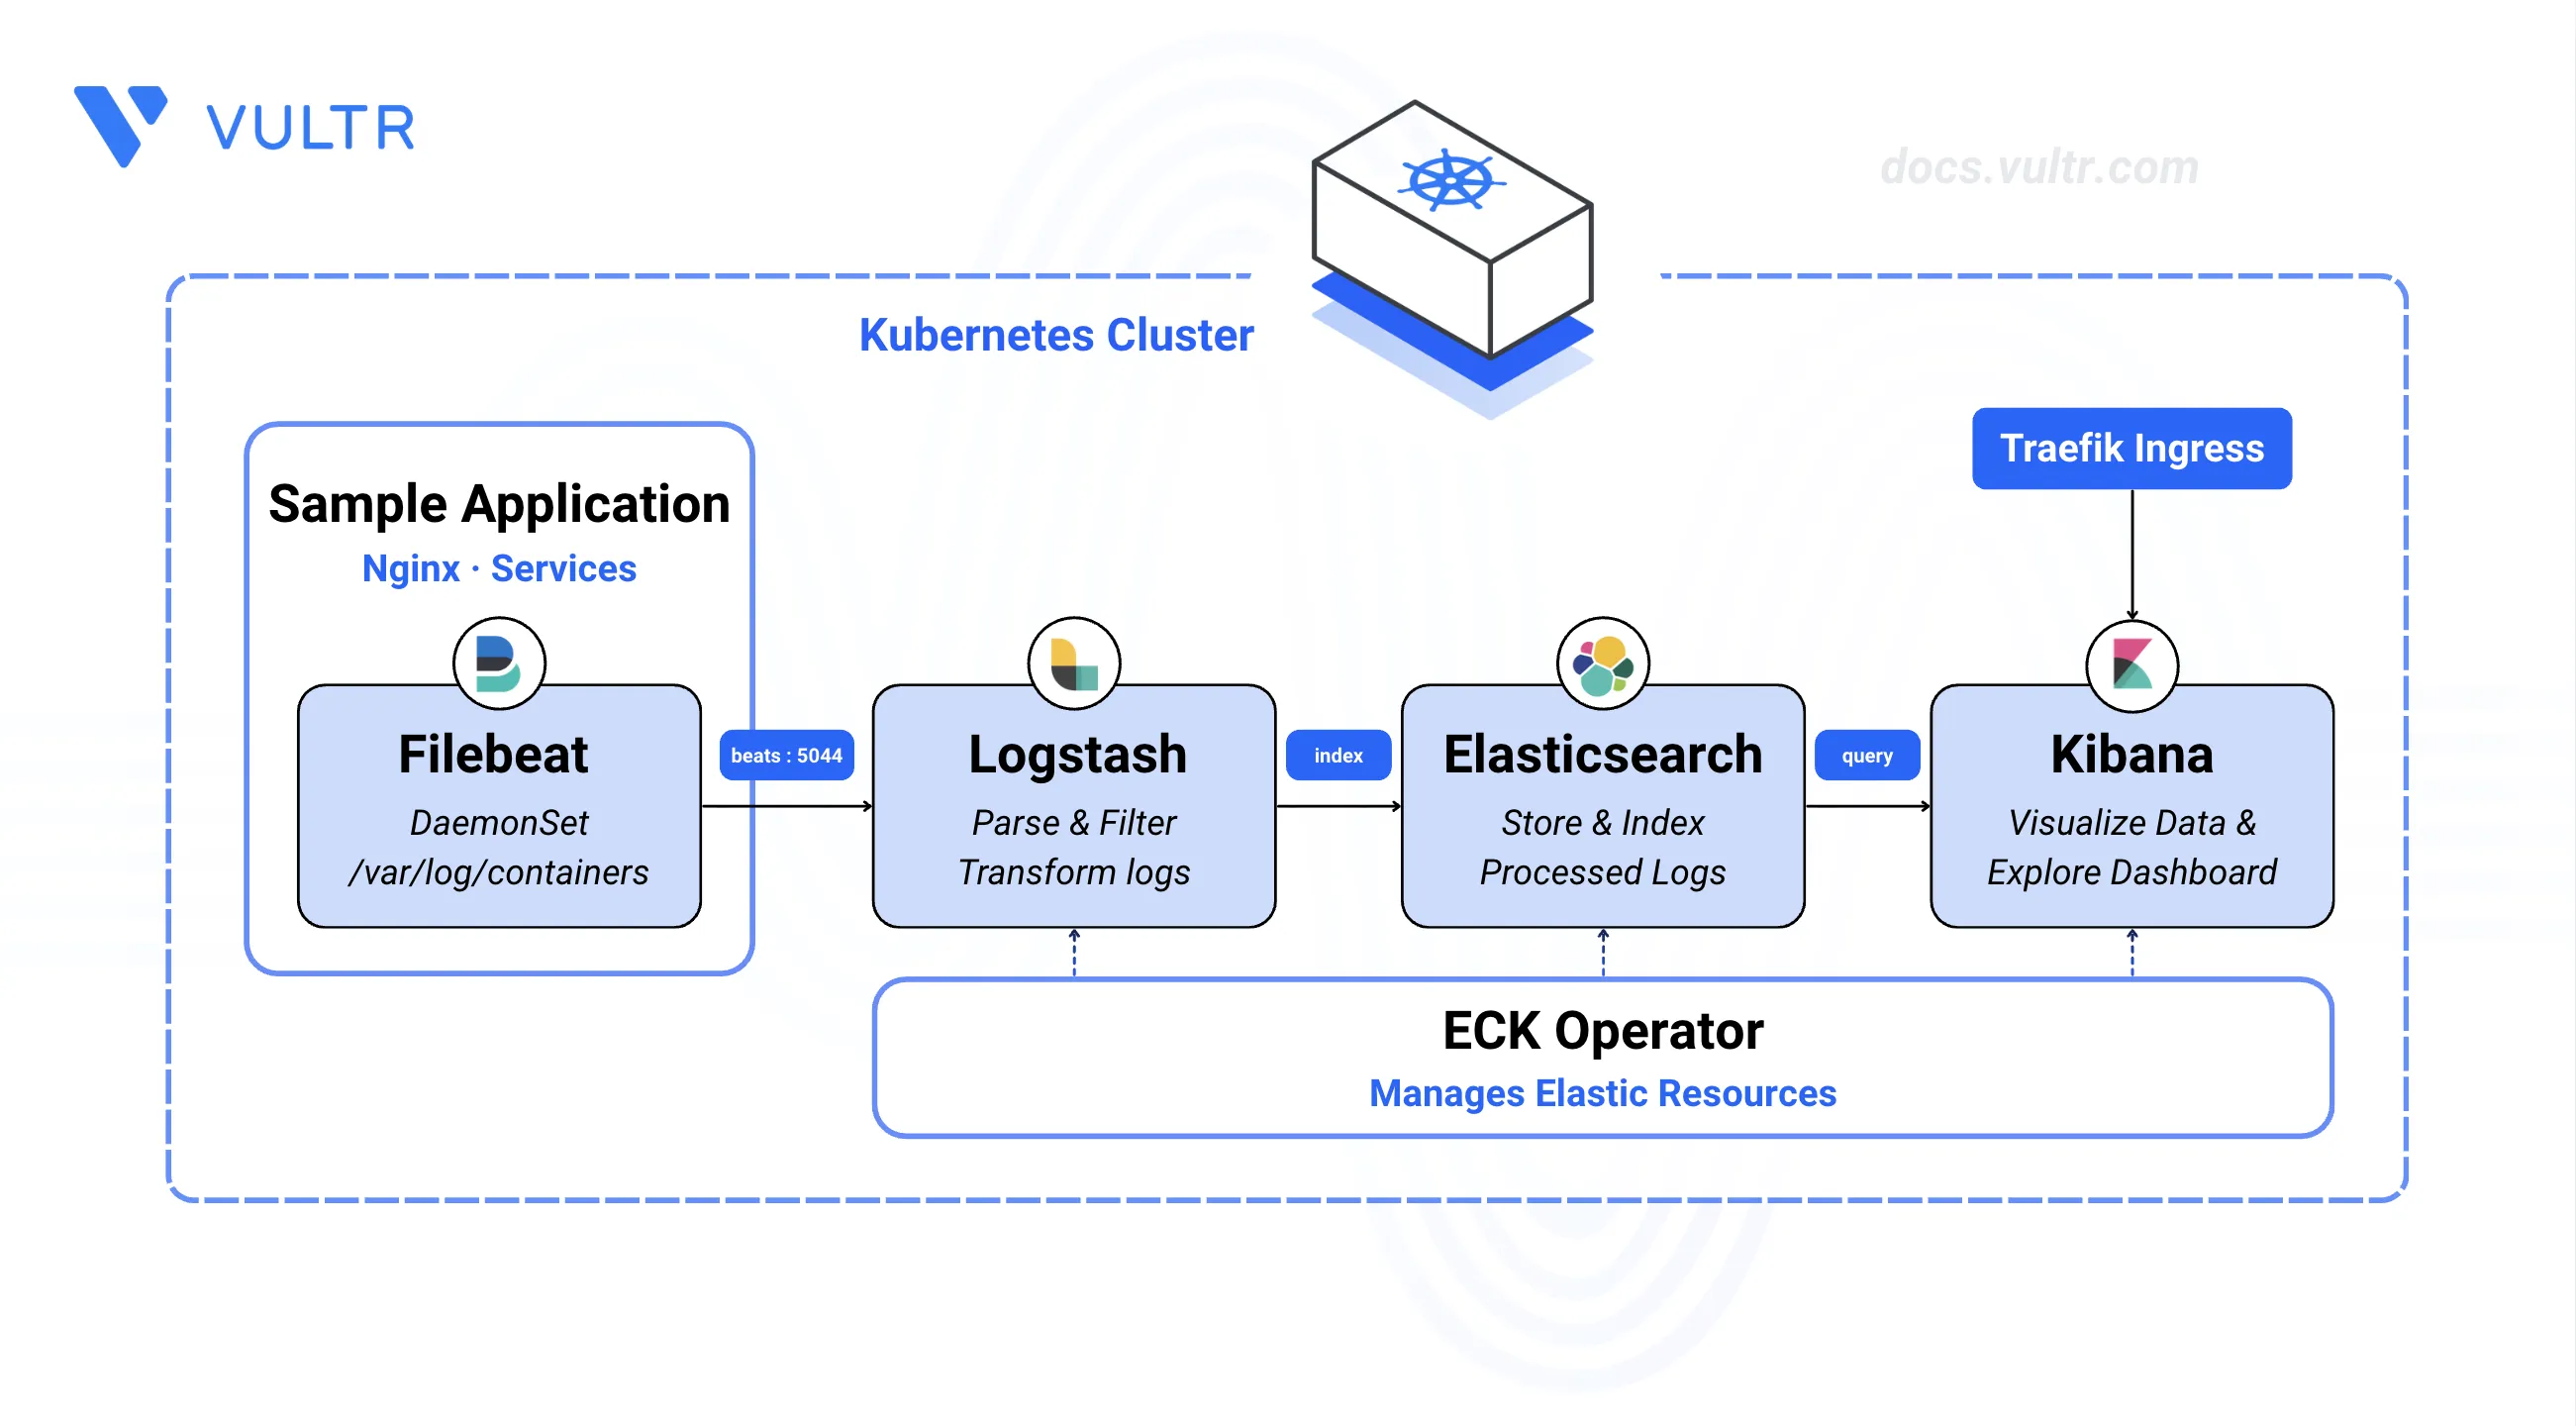
The Elastic Stack (commonly known as the ELK Stack) is a collection of open-source tools for searching, analyzing, and visualizing log data in real time. It consists of Elasticsearch, Logstash, Kibana, and Beats (including Filebeat), which work together to collect, process, store, and visualize logs from applications and infrastructure. Organizations use the Elastic Stack to centralize logging, monitor system performance, detect security threats, and gain actionable insights from their data.
This article outlines the deployment of the ELK Stack on Kubernetes using the Elastic Cloud on Kubernetes (ECK) operator. It covers deploying Elasticsearch, Logstash, Kibana, and Filebeat, securing access with Traefik and Let's Encrypt SSL certificates, and visualizing cluster logs through the Kibana dashboard.
Prerequisites
Before you begin, you need to:
- Have a Kubernetes cluster with at least 3 nodes, each with a minimum of 4 GB RAM. Actual requirements vary based on the number of log sources and ingestion volume.
- Install and configure kubectl on your workstation to access your Kubernetes cluster.
- Install Helm on your workstation.
- Have a registered domain name for accessing Kibana (for example,
kibana.example.com).
Install Elasticsearch
Elasticsearch is a distributed, RESTful search and analytics engine that stores and indexes log data for fast retrieval. It serves as the central data store for the Elastic Stack, enabling full-text search, structured queries, and aggregations across large volumes of log data.
The Elastic Cloud on Kubernetes (ECK) operator simplifies deploying and managing Elasticsearch on Kubernetes by handling cluster configuration, scaling, and upgrades automatically.
Install the Elastic operator custom resource definitions (CRDs). Replace
3.4.0with the latest stable version from the ECK releases page.CONSOLEInstall the Elastic operator.
CONSOLEThe output confirms the operator resources are created including the namespace, service account, and statefulset.
List all pods in the
elastic-systemnamespace and verify that the Elastic Operator is running.CONSOLEThe output shows the
elastic-operator-0pod withRunningstatus.Create a new
elasticsearch.yamlfile.CONSOLEAdd the following YAML contents to the file.
YAMLSave and close the file.
The above configuration creates an Elasticsearch cluster with the following settings:
version: Specifies the Elasticsearch version to deploy.nodeSets: Defines the cluster topology with one node in the default node set.config.node.store.allow_mmap: Disables memory-mapped files to avoid permission issues in containerized environments.volumeClaimTemplates: Configures persistent storage for Elasticsearch data. ThestorageClassNamemust match your cluster's available storage class. For Vultr Kubernetes Engine (VKE), usevultr-block-storage-hdd. Runkubectl get storageclassto list available storage classes for your provider.
Apply the
elasticsearch.yamlconfiguration to your cluster.CONSOLEWait at least 2 minutes, then list the Elasticsearch pods and verify that they are running.
CONSOLEThe output shows the
quickstart-es-default-0pod withRunningstatus.Get the Elasticsearch service status and verify the assigned cluster IP.
CONSOLEThe output displays the ClusterIP service listening on port
9200.List all Persistent Volume Claims (PVCs) and verify that the Elasticsearch volume is bound.
CONSOLEThe output shows the
elasticsearch-data-quickstart-es-default-0PVC withBoundstatus.Monitor the Elasticsearch health and verify that the cluster is ready.
CONSOLEThe output shows the cluster with
Readyphase. With a single-node setup, the health may showyellowbecause replica shards cannot be placed. This is expected. If the health showsred, verify that the pods, service, and PVC resources are running and bound correctly.Retrieve and store the generated password for the
elasticuser.CONSOLECopy the generated password from the output. You need this password to authenticate with Elasticsearch and Kibana.
Install Logstash
Logstash is a server-side data processing pipeline that ingests, transforms, and forwards logs to Elasticsearch. It receives logs from various sources (including Filebeat), applies filters to parse and enrich the data, and sends the processed logs to Elasticsearch for storage and indexing.
Create a new
logstash.yamlfile.CONSOLEAdd the following YAML contents to the file.
YAMLSave and close the file.
The above configuration creates a Logstash instance with the following settings:
elasticsearchRefs: Links Logstash to the Elasticsearch cluster namedquickstart. The ECK operator automatically injects connection credentials as environment variables.pipelines: Defines the data processing pipeline:input.beats: Configures Logstash to receive logs from Filebeat on port 5044.filter.mutate: Adds anenvironmentfield to each log entry based on the Kubernetes namespace, enabling filtering by namespace in Kibana.output.elasticsearch: Sends processed logs to Elasticsearch using credentials injected by ECK. Logs are indexed with a daily pattern (logstash-YYYY.MM.dd).
services: Exposes a ClusterIP service on port 5044 for Filebeat to send logs.volumeClaimTemplates: Configures persistent storage for Logstash data and queue persistence. For Vultr Kubernetes Engine (VKE), usevultr-block-storage-hdd. Adjust thestorageClassNamebased on your cluster's storage provider.
Apply the
logstash.yamlconfiguration to install Logstash in your cluster.CONSOLEList the Logstash pods and verify that they are running.
CONSOLEThe output shows the
quickstart-ls-0pod withRunningstatus.Monitor the Logstash health and verify that it is ready.
CONSOLEThe output shows
greenhealth and1/1available replicas.
Install Filebeat
Filebeat is a lightweight log shipper that runs as a DaemonSet on every node in the Kubernetes cluster. It collects container logs from /var/log/containers/ and ships them to Logstash or Elasticsearch for processing. Filebeat automatically enriches logs with Kubernetes metadata such as pod name, namespace, and labels, making it easier to filter and analyze logs in Kibana.
Create a new
filebeat.yamlfile.CONSOLEAdd the following YAML contents to the file.
YAMLSave and close the file.
The above configuration deploys Filebeat as a DaemonSet with the following settings:
spec.type: Specifies Filebeat as the Beat type.config.filebeat.inputs: Configures log collection:type: filestream: Uses the filestream input to read container log files.paths: Collects all container logs from/var/log/containers/.parsers.container: Parses container log format automatically.prospector.scanner.symlinks: Follows symbolic links to locate actual log files.
processors:add_kubernetes_metadata: Enriches each log entry with Kubernetes metadata (pod name, namespace, labels) based on the log file path.drop_event.when: Filters out logs from system namespaces (kube-system,kube-public,elastic-system,kube-node-lease) to reduce noise.
output.logstash: Sends collected logs to Logstash on port 5044 for processing before indexing in Elasticsearch. Internal cluster communication over ClusterIP does not require additional SSL configuration.daemonSet.podTemplate: Configures the Filebeat pods:hostNetwork: true: Allows Filebeat to access node-level network for metadata enrichment.volumes: Mounts host paths to access container log files.securityContext.runAsUser: 0: Runs as root to read log files with restricted permissions.
Create a new
filebeat-rbac.yamlfile to define the Role-Based Access Control (RBAC) configuration for Filebeat.CONSOLEAdd the following YAML contents to the file.
YAMLSave and close the file.
The above configuration creates RBAC resources that allow Filebeat to:
ServiceAccount: Provides an identity for Filebeat pods.ClusterRole: Grants read-only access to namespaces, pods, and nodes across the cluster for metadata enrichment.ClusterRoleBinding: Binds the ClusterRole to the Filebeat ServiceAccount.
Apply the configurations to install Filebeat in your cluster.
CONSOLEList the Filebeat pods and verify that they are running on all nodes.
CONSOLEThe output shows one Filebeat pod per node with
Runningstatus.Monitor the Filebeat health and verify that it is ready.
CONSOLEThe output shows
greenhealth with the expected number of available replicas matching your node count.
Install and Configure Kibana Dashboards
Kibana is the visualization and exploration interface for the Elastic Stack. It provides a web-based dashboard for searching, viewing, and analyzing logs stored in Elasticsearch. Kibana supports interactive charts, graphs, and maps, enabling real-time monitoring and troubleshooting of applications and infrastructure.
Create a new
kibana.yamlfile.CONSOLEAdd the following YAML contents to the file.
YAMLSave and close the file.
The above configuration deploys Kibana with the following settings:
elasticsearchRef: Connects Kibana to the Elasticsearch cluster namedquickstart. ECK automatically configures authentication credentials.http.tls.selfSignedCertificate.disabled: Disables the self-signed certificate since Traefik handles TLS termination with Let's Encrypt certificates.
Apply the
kibana.yamlfile to install Kibana in your cluster.CONSOLEList all Kibana pods and verify that they are running.
CONSOLEThe output shows the
quickstart-kb-*pod withRunningstatus.Get the Kibana service status and verify the assigned cluster IP.
CONSOLEThe output displays the ClusterIP service listening on port
5601.Monitor the Kibana health and verify that it is ready.
CONSOLEThe output shows
greenhealth andReadystatus.
Secure the ELK Stack
The Kibana dashboard requires secure TLS connections for production use. Traefik functions as an Ingress controller to route external traffic to Kibana, while cert-manager automatically provisions and renews Let's Encrypt SSL certificates.
Add the Traefik Helm chart repository.
CONSOLEUpdate the local Helm repository.
CONSOLEInstall Traefik as an Ingress Controller in your cluster.
CONSOLEGet all resources deployed to the
traefiknamespace and verify that the deployment is ready.CONSOLEThe output shows the Traefik pod, service, deployment, and replicaset. Verify that the pod shows
Runningstatus.Wait at least 3 minutes for the LoadBalancer to provision, then retrieve the external IP address.
CONSOLEThe output displays the
EXTERNAL-IPcolumn with your public IP address. If it shows<pending>, wait a few more minutes for the cloud provider to assign an IP.Log in to your DNS provider (such as Vultr DNS) and create a DNS A record pointing your domain (for example,
kibana.example.com) to the LoadBalancer's external IP address.Install cert-manager in your cluster. Replace
v1.20.2with the latest stable version from the cert-manager releases page.CONSOLEList the cert-manager pods and verify that they are running.
CONSOLEThe output shows all cert-manager pods with
Runningstatus.Create a new
issuer.yamlfile.CONSOLEAdd the following YAML contents to the file. Replace
admin@example.comwith your active email address.YAMLSave and close the file.
The above configuration creates a ClusterIssuer that:
- Uses the Let's Encrypt production Automated Certificate Management Environment (ACME) server for trusted certificates.
- Stores the account private key in a Kubernetes secret.
- Uses HTTP-01 challenge verification with Traefik as the Ingress controller.
Apply the ClusterIssuer configuration.
CONSOLECreate a new
kibana-ingress.yamlfile.CONSOLEAdd the following Ingress contents to the file. Replace
kibana.example.comwith your actual domain.YAMLSave and close the file.
The above configuration:
- Routes all HTTPS traffic from
kibana.example.comto the Kibana service on port 5601. - Uses the
letsencryptClusterIssuer to automatically provision and renew TLS certificates. - Stores the certificate in a Kubernetes secret named
kibana-tls.
- Routes all HTTPS traffic from
Apply the
kibana-ingress.yamlconfiguration to your cluster.CONSOLEList all Ingress resources and verify that Kibana is available.
CONSOLEThe output shows the
kibanaIngress with your domain in theHOSTScolumn.Verify the certificate is issued successfully.
CONSOLEThe output shows
kibana-tlswithTruein theREADYcolumn. If it showsFalse, wait a few minutes for cert-manager to complete the ACME challenge.Test HTTPS access to your domain.
CONSOLEThe output shows
HTTP/2 200or a redirect to the Kibana login page, confirming TLS is working.
Access Kibana Dashboards
The Kibana web interface provides tools for exploring and visualizing log data from your Kubernetes cluster. Access the dashboard using your configured domain with the Elasticsearch credentials.
Retrieve the
elasticuser password.CONSOLECopy the password from the output.
Open a web browser and navigate to
https://kibana.example.com. Replacekibana.example.comwith your configured domain.Log in to Kibana with the following credentials:
- Username:
elastic - Password: The password retrieved in the previous step
- Username:
Click Explore on my own to access the main dashboard.
Visualize the Kubernetes Cluster
Kibana's Discover feature allows you to search and filter logs collected by Filebeat from your Kubernetes cluster.
Expand the main menu in the top left corner.
Click Discover within the Analytics group.
Select the
logstash-*data view from the dropdown menu. If no data view exists, create one:- Navigate to Stack Management > Data Views.
- Click Create data view.
- Enter
logstash-*as the name and index pattern. - Select
@timestampas the time field. - Click Save data view to Kibana.
Use the search bar to filter logs by namespace, pod name, or message content. For example:
kubernetes.namespace: default: Shows logs from the default namespace.kubernetes.pod.name: demo-app*: Shows logs from pods with names starting withdemo-app.message: error: Shows logs containing the word "error".
Adjust the time range using the date picker in the top right corner to view logs from specific time periods.
Click on any log entry to expand and view the full document, including Kubernetes metadata such as pod labels, container name, and node information.
Troubleshooting
Use the following checks to diagnose and resolve common issues encountered during deployment.
Common Deployment Errors and Solutions
Elasticsearch pod stuck in Pending state
Run
kubectl describe pod quickstart-es-default-0to check the events. Common causes include:- Insufficient resources: The node lacks sufficient CPU or memory. Scale up your cluster or reduce resource requests in the Elasticsearch configuration.
- PVC not binding: The storage class does not exist or has no available capacity. Run
kubectl get storageclassto verify available storage classes and update thestorageClassNameinelasticsearch.yaml.
Elasticsearch health shows yellow or red
Run
kubectl get elasticsearchto check the cluster status. Ayellowstatus is normal for a single-node deployment because replica shards cannot be placed. For production workloads, increasenodeSets.countto at least 3 to achievegreenhealth. If shards remain unassigned after scaling, runkubectl logs quickstart-es-default-0to check for disk space or memory issues.A
redstatus indicates primary shards are unavailable. Check pod logs for out-of-memory errors or storage failures.Filebeat pods not collecting logs
Verify the RBAC configuration is applied correctly:
CONSOLEIf any resource is missing, reapply
filebeat-rbac.yaml. Also verify the host path volumes are accessible by checking Filebeat logs:CONSOLECertificate not issued by cert-manager
Check the certificate status and events:
CONSOLECommon causes include:
- DNS not propagated: Verify your domain resolves to the LoadBalancer IP using
dig kibana.example.com. - HTTP-01 challenge failing: Verify Traefik is running and port 80 is accessible from the internet.
- DNS not propagated: Verify your domain resolves to the LoadBalancer IP using
Kibana shows "Kibana server is not ready yet"
Kibana requires Elasticsearch to be healthy before starting. Verify Elasticsearch status:
CONSOLEIf Elasticsearch shows
greenhealth but Kibana still fails, check Kibana logs:CONSOLELoadBalancer IP shows pending
Cloud providers may take several minutes to provision a LoadBalancer. If the status remains
<pending>after 5 minutes:- Verify your Kubernetes cluster supports LoadBalancer services (requires cloud provider integration).
- Check the Traefik service events:
kubectl describe service traefik -n traefik.
Conclusion
You have deployed the ELK Stack on Kubernetes using the ECK operator. Filebeat collects logs from every node in the cluster, Logstash processes and enriches them, Elasticsearch stores and indexes the data, and Kibana visualizes it through a dashboard secured with a Let's Encrypt TLS certificate. For more information on advanced configurations including multi-node clusters, custom pipelines, and alerting, refer to the official Elastic Cloud on Kubernetes documentation.
Tags:Kubernetes


0 Comments
Be the first to comment and share your perspective with the community.