

Introduction
Jaeger is a distributed tracing platform used to monitor and troubleshoot a complex microservices environment. Implementing distributed tracing is essential for modern software applications when troubleshooting and tracking performance issues, especially in the micro-services architecture.
Jaeger monitors and analyzes the requests flow between different microservices in distributed systems and helps developers identify bottlenecks, latency issues, and errors within the system.
Jaeger is made up of several components that work together to offer distributed tracing capabilities. Below are the major components responsible for the different aspects of trace collection, storage, and visualization.
- Agent: Retrieves the incoming trace data, processes it, and forwards the processed version to the appropriate backends
- Query: Offers a web-based that allows you to search, retrieve, view trace data, and analyze the flow of requests in your applications
- Collector: Collects incoming traces from the Jaeger agent, runs validations, and sends them to the backend storage
This article explains how you can deploy Jaeger on a Vultr Kubernetes Engine (VKE) cluster. You will set up Jaeger to trace a Golang application within the cluster.
Prerequisites
Before you start:
Deploy a Vultr Kubernetes Engine cluster with at least
3nodesDeploy a Vultr Debian server to use as the management machine
Using SSH, access the server
Install and Configure Kubectl to access the cluster
Install the Helm package manager
$ snap install helm --classic
Install the Jaeger Operator
Using Helm, add the Jaeger Tracing repository to your charts
$ helm repo add jaegertracing https://jaegertracing.github.io/helm-chartsUpdate the Helm repository index
$ helm repo updateInstall Jaeger Operator to your cluster
$ helm install jaeger-operator jaegertracing/jaeger-operator --namespace observability --create-namespace --set rbac.clusterRole=trueOutput:
 NAME: jaeger-operator
 LAST DEPLOYED: Sun Oct 29 20:11:39 2023
 NAMESPACE: observability
 STATUS: deployed
 REVISION: 1
 TEST SUITE: None
 NOTES:
 jaeger-operator is installed.

 Check the jaeger-operator logs
   export POD=$(kubectl get pods -l app.kubernetes.io/instance=jaeger-operator -l app.kubernetes.io/name=jaeger-operator --namespace observability --output name)
   kubectl logs $POD --namespace=observability
Verify the list of installed Helm packages in your VKE cluster
$ helm list -AOutput:
 NAME            NAMESPACE       REVISION    UPDATED                                 STATUS      CHART                   APP VERSION
 jaeger-operator observability   1           2023-10-25 14:17:40.390191139 +0530 IST deployed    jaeger-operator-2.49.0  1.49.0
Verify that the Jaeger Operator pod is ready and running in your cluster
$ kubectl get pod -n observabilityOutput:
 NAME                             READY   STATUS    RESTARTS   AGE
 jaeger-operator-b89c6b9b-9x65d   1/1     Running   0          53m
Deploy the Jaeger All-In-One image
The Jaeger Operator is installed and available in your cluster, but it cannot function without supporting Jaeger resources. Install the Jaeger All-In-One image to deploy the necessary instances to develop and test cluster operations.
Using a text editor such as Nano, create a new
jaeger.ymlfile to define the Jaeger instance$ nano jaeger.ymlAdd the following configurations to the file
 apiVersion: jaegertracing.io/v1
 kind: Jaeger
 metadata:
   name: jaeger
 spec:
   query:
     serviceType: LoadBalancer
Save and close the file
Apply the Jaeger resource to your clusterabove resources to the Kubernetes.
$ kubectl apply -f jaeger.ymlVerify that Jaeger is running with an
allinonestrategy$ kubectl get jaegersOutput:
 NAME     STATUS    VERSION   STRATEGY   STORAGE   AGE
 jaeger   Running   1.49.0    allinone   memory    8s
Verify the running Jaeger pod name
$ kubectl get pods -l app.kubernetes.io/instance=jaegerOutput:
 NAME                     READY   STATUS    RESTARTS   AGE
 jaeger-8b48f49db-tjq6v   1/1     Running   0          55m
View the Jaeger pod logs to verify the background activity
$ kubectl logs -l app.kubernetes.io/instance=jaegerOutput:
  {"level":"info","ts":1697896855.8030396,"caller":"grpc@v1.57.0/clientconn.go:565","msg":"[core][Channel #10] Channel Connectivity change to READY","system":"grpc","grpc_log":true}
  {"level":"info","ts":1697896855.8032107,"caller":"grpc@v1.57.0/clientconn.go:1301","msg":"[core][Channel #6 SubChannel #8] Subchannel Connectivity change to READY","system":"grpc","grpc_log":true}
  {"level":"info","ts":1697896855.803359,"caller":"base/balancer.go:177","msg":"[roundrobin]roundrobinPicker: Build called with info: {map[SubConn(id:8):{{Addr: \":14250\", ServerName: \"\", }}]}","system":"grpc","grpc_log":true}
  {"level":"info","ts":1697896855.8034499,"caller":"grpc@v1.57.0/clientconn.go:565","msg":"[core][Channel #6] Channel Connectivity change to READY","system":"grpc","grpc_log":true}
  {"level":"info","ts":1697896855.803539,"caller":"grpc/builder.go:124","msg":"Agent collector connection state change","dialTarget":":14250","status":"READY"}
  {"level":"info","ts":1697896856.7546606,"caller":"grpc@v1.57.0/clientconn.go:1303","msg":"[core][Channel #1 SubChannel #2] Subchannel Connectivity change to IDLE, last error: connection error: desc = \"transport: Error while dialing: dial tcp [::1]:4317: connect: connection refused\"","system":"grpc","grpc_log":true}
  {"level":"info","ts":1697896856.7552433,"caller":"grpc@v1.57.0/clientconn.go:1301","msg":"[core][Channel #1 SubChannel #2] Subchannel Connectivity change to CONNECTING","system":"grpc","grpc_log":true}
  {"level":"info","ts":1697896856.7554233,"caller":"grpc@v1.57.0/clientconn.go:1414","msg":"[core][Channel #1 SubChannel #2] Subchannel picks a new address \"localhost:4317\" to connect","system":"grpc","grpc_log":true}
  {"level":"info","ts":1697896856.7570865,"caller":"grpc@v1.57.0/clientconn.go:1301","msg":"[core][Channel #1 SubChannel #2] Subchannel Connectivity change to READY","system":"grpc","grpc_log":true}
  {"level":"info","ts":1697896856.7573693,"caller":"grpc@v1.57.0/clientconn.go:565","msg":"[core][Channel #1] Channel Connectivity change to READY","system":"grpc","grpc_log":true}
Verify the list of available Jaeger services
$ kubectl get svc -l app=jaegerOutput:
 NAME                        TYPE           CLUSTER-IP      EXTERNAL-IP      PORT(S)                                                              AGE
 jaeger-agent                ClusterIP      None            <none>           5775/UDP,5778/TCP,6831/UDP,6832/UDP,14271/TCP                        55m
 jaeger-collector            ClusterIP      10.108.94.104   <none>           9411/TCP,14250/TCP,14267/TCP,14268/TCP,14269/TCP,4317/TCP,4318/TCP   55m
 jaeger-collector-headless   ClusterIP      None            <none>           9411/TCP,14250/TCP,14267/TCP,14268/TCP,14269/TCP,4317/TCP,4318/TCP   55m
 jaeger-query                LoadBalancer   10.98.215.158   192.0.2.1      16686:32086/TCP,16685:32707/TCP,16687:32697/TCP                      55m
Verify and copy the Load Balancer public IP address included in the
jaeger-queryEXTERNAL-IP field.Using a web browser such as Firefox, load the Jaeger web interface on port
16686using your external IP address. Replace the example IP192.0.2.1with your actual public IPhttp://192.0.2.1:16686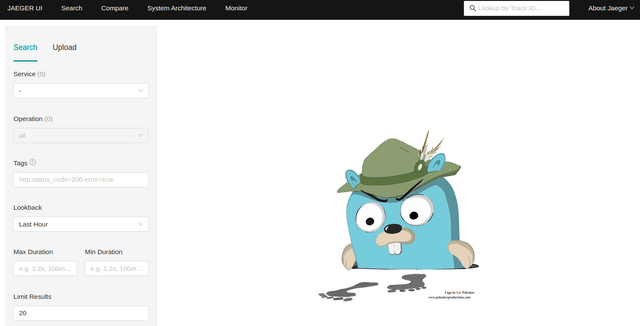
Deploy a Sample Golang Application to Trace
In this section, you will deploy a Golang Application on Kubernetes using an image ovhplatform/what-is-my-pod-with-tracing:1.0.2 hosted on the Docker Hub. This application will send traces to the Jaeger collector for distributed tracing and monitoring.
Create a new deployment YAML file to define the Golang application
$ nano deployment.ymlAdd the following configurations to the file
 apiVersion: apps/v1
 kind: Deployment
 metadata:
   name: tracing-deployment
   labels:
     app: tracing-deployment
 spec:
   replicas: 3
   selector:
     matchLabels:
       app: tracing-deployment
   template:
     metadata:
       labels:
         app: tracing-deployment
     spec:
       containers:
       - name: tracing-deployment
         image: ovhplatform/what-is-my-pod-with-tracing:1.0.2
         ports:
         - containerPort: 8080
         env:
           - name: MY_POD_NAME
             valueFrom:
               fieldRef:
                 fieldPath: metadata.name
Save and close the file.
The above configuration creates a new Golang application deployment using the
ovhplatform/what-is-my-pod-with-tracing:1.0.2and the custom pods nameMY_POD_NAME. Replace these values with your desired source image and pods name for smooth cluster operations.Deploy the application to your cluster
$ kubectl apply -f deployment.ymlVerify that your Golang application is available and running
$ kubectl get pod -l app=tracing-deploymentOutput:
 NAME                                  READY   STATUS    RESTARTS   AGE
 tracing-deployment-7f94fffb89-5c2zn   1/1     Running   0          24m
 tracing-deployment-7f94fffb89-nsx56   1/1     Running   0          24m
 tracing-deployment-7f94fffb89-wz25d   1/1     Running   0          24m
Create a service manifest to expose the Golang application on port
8080$ nano service.ymlAdd the following configuration to the file.
 apiVersion: v1
 kind: Service
 metadata:
   labels:
     app: tracing-deployment
   name: tracing-deployment
 spec:
   ports:
   - port: 8080
   selector:
     app: tracing-deployment
   type: LoadBalancer
Save and close the file.
Apply the configuration to your cluster
$ kubectl apply -f svc.ymlView the new load balancer IP address assignment to the Golang application
$ kubectl get svc -l app=tracing-deploymentOutput:
 NAME                 TYPE           CLUSTER-IP     EXTERNAL-IP      PORT(S)          AGE
 tracing-deployment   LoadBalancer   10.96.48.102   192.0.2.2   8080:31733/TCP   24m
Verify and keep note of the EXTERNAL-IP value to use when accessing the application.
Visualize Traces using the Jaeger UI
The sample Golang application is deployed to your cluster and able to send traces to Jaeger. Test and visualize all active traces using the Jaeger web interface as described below.
Using Curl, access the Golang application on the service port
8080using the application's external IP to start tracingcurl http://203.0.113.2:8080When successful, your output should look like the one below:
Hello "tracing-deployment-7f94fffb89-nsx56"!In your web browser session, access the Jaeger web interface again
http://192.0.2.1:16686Navigate to
go-what-is-my-pod-with-tracingin the service menu and click the Find Traces button to view the available traces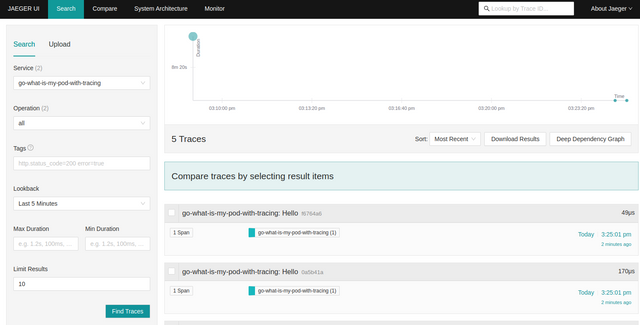
Click any of the traces and visualize useful information
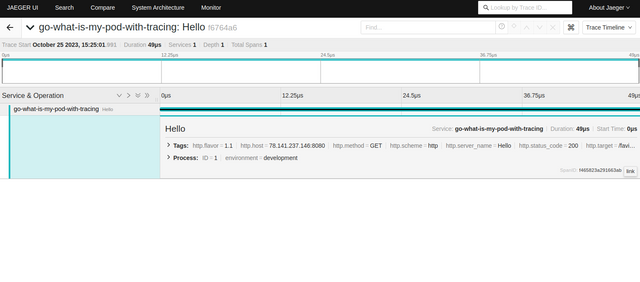
To send more traces, access your Golang application again and keep track of the available traces in your Jaeger interface
Conclusion
You have deployed Jaeger on a Vultr Kubernetes Engine (VKE) cluster and set up a sample Golang application to send traces for visualization within the cluster. For more information about Jaeger, visit the official documentation.
No comments yet.