How to Deploy Zabbix – Open-Source Monitoring Platform
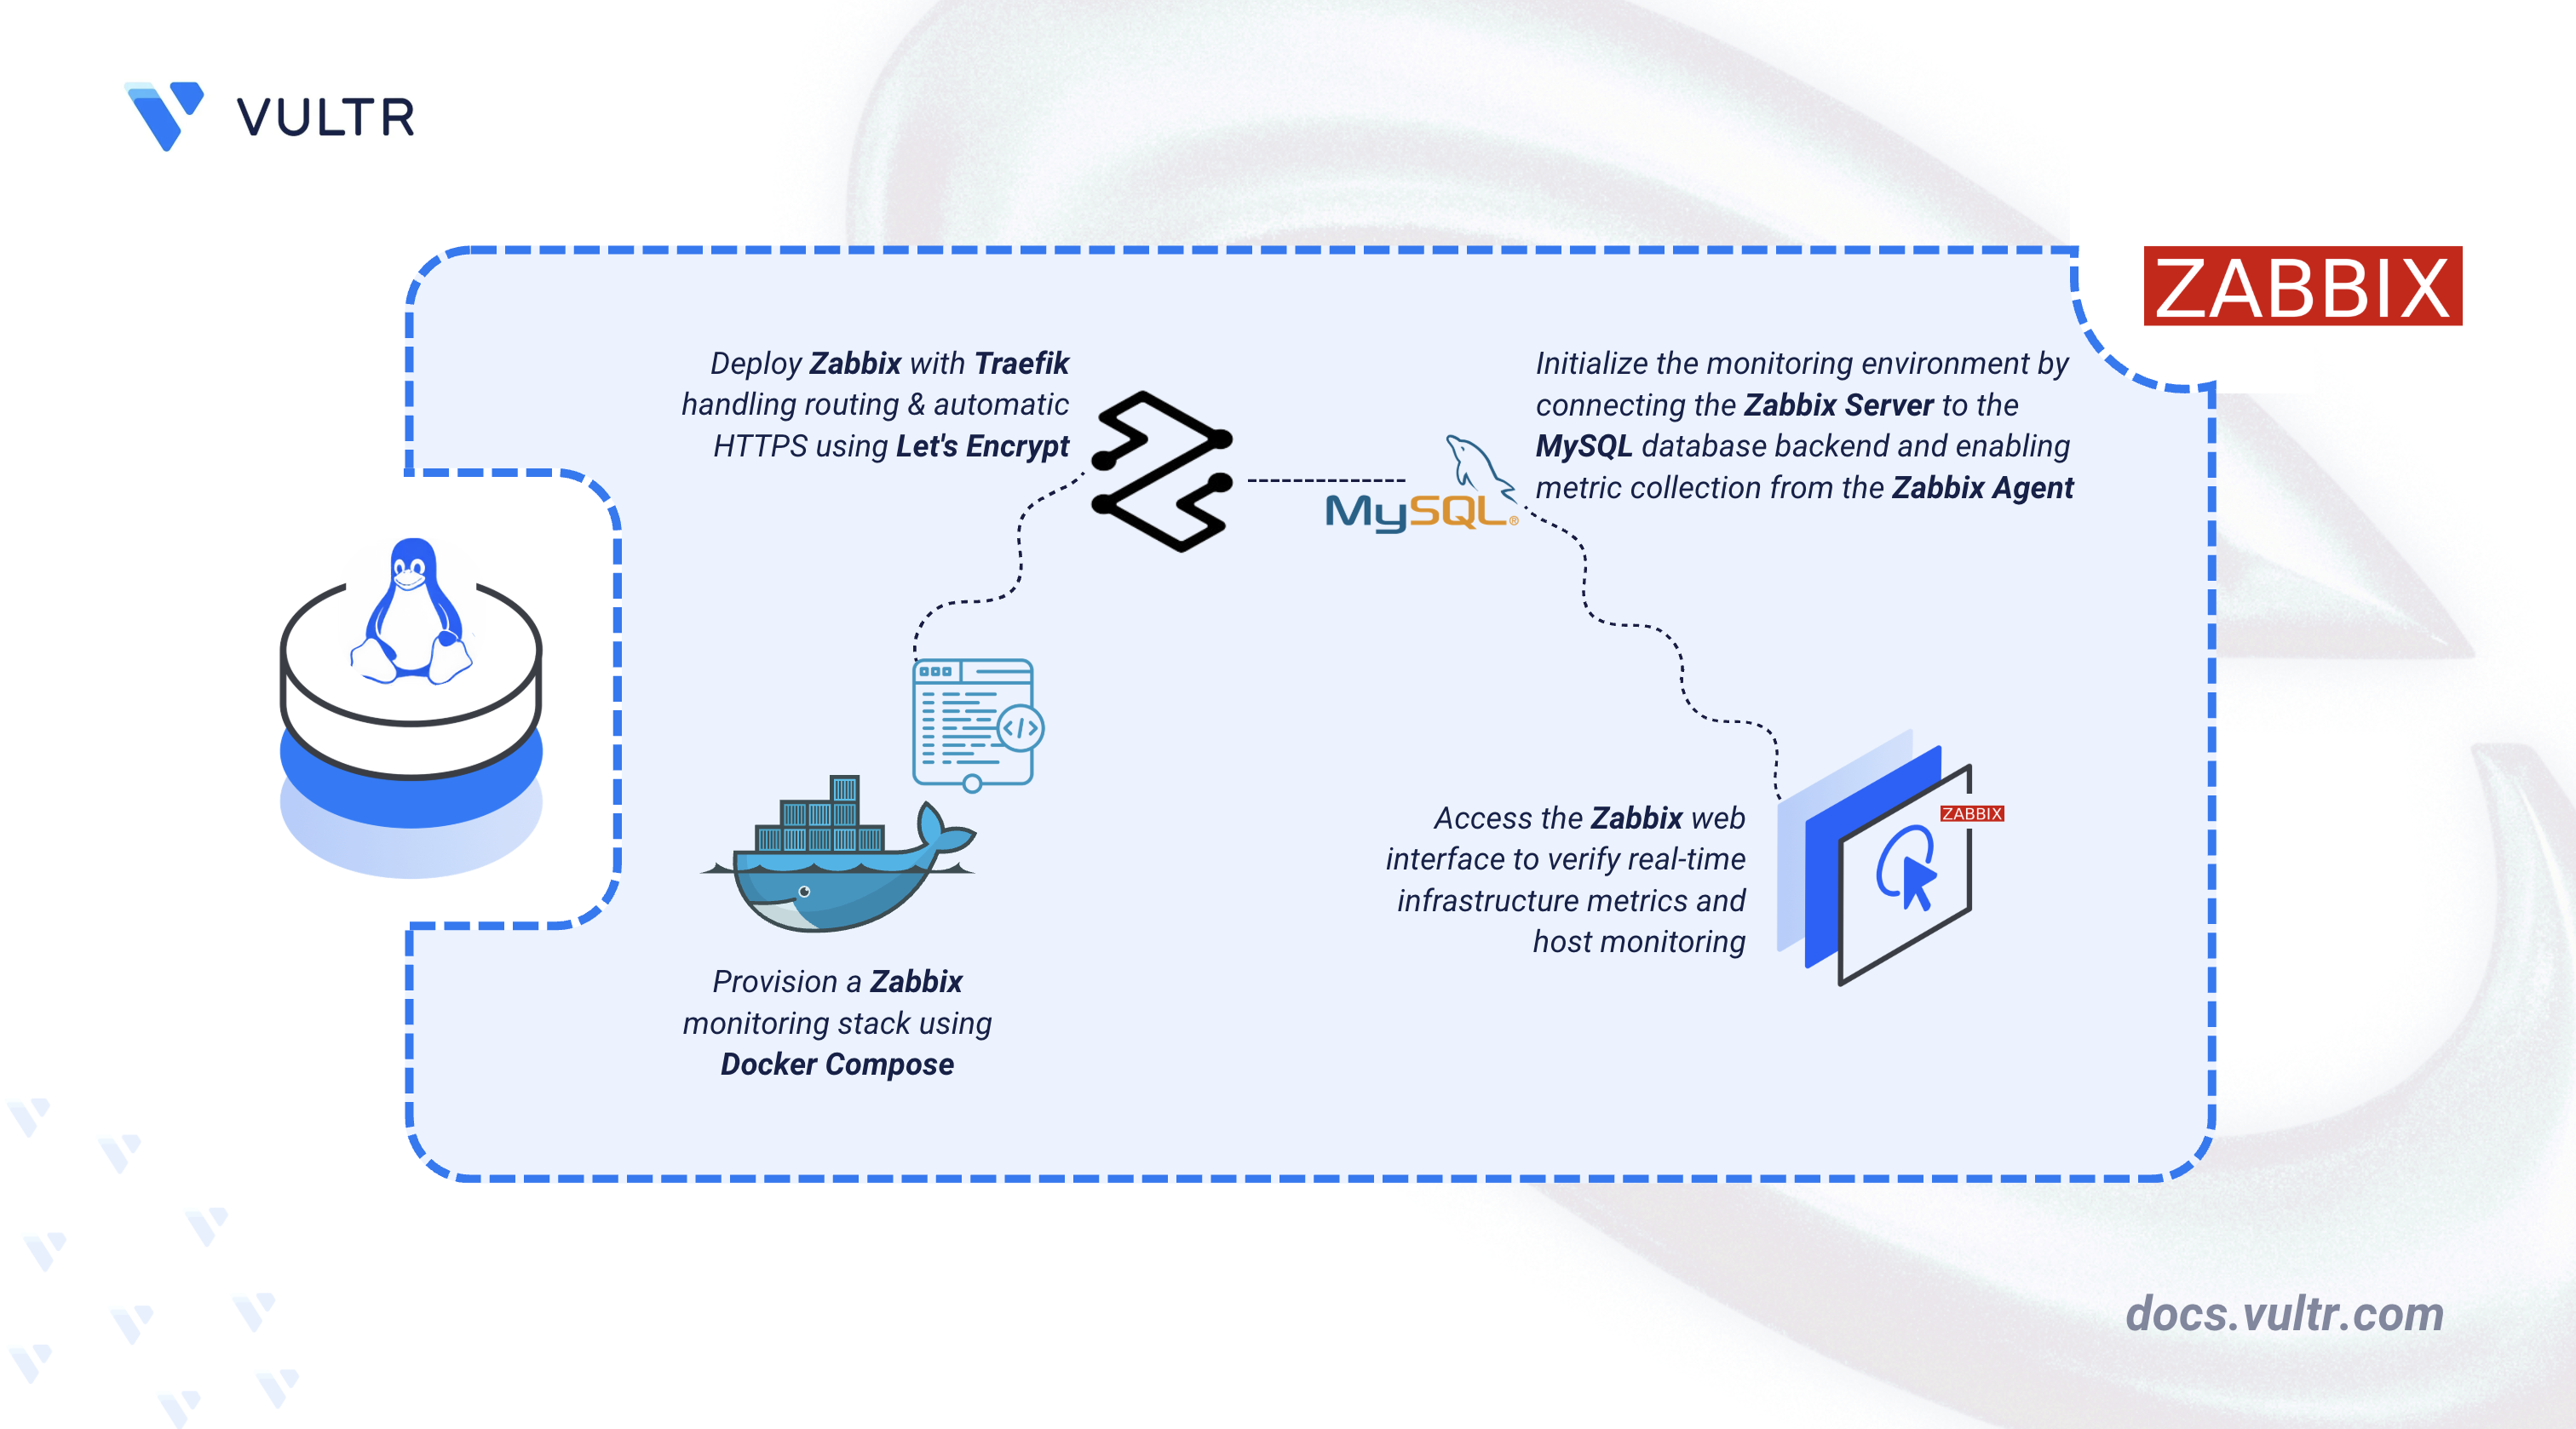
Zabbix is an open-source monitoring platform that tracks the health and performance of servers, networks, applications, and services. It collects metrics, triggers alerts based on configurable thresholds, and provides dashboards for visualizing infrastructure status. Zabbix supports monitoring through agents, Java Management Extensions (JMX), and custom scripts.
This article explains how to deploy Zabbix using Docker Compose with a MySQL database and a Traefik reverse proxy that provisions an HTTPS certificate through Let's Encrypt.
Prerequisites
Before you begin, you need to:
- Have access to a Linux-based server as a non-root user with sudo privileges.
- Install Docker and Docker Compose.
- Configure a DNS A record pointing to your server's IP address (for example,
zabbix.example.com).
Set Up the Project Directory
The project directory holds the Docker Compose file and environment variables for the deployment.
Create the project directory.
CONSOLEEnter the project directory.
CONSOLECreate the environment variable file.
CONSOLEAdd the following variables:
INIReplace the placeholders:
zabbix.example.com: Your registered domain name.admin@example.com: Your email address for Let's Encrypt certificate notifications.YOUR_DB_PASSWORD: A strong password for thezabbixdatabase user.YOUR_ROOT_PASSWORD: A strong password for the MySQL root account.
Save and close the file.
Deploy with Docker Compose
The Compose file defines the Traefik reverse proxy, the Zabbix Server, the Zabbix web frontend, the MySQL database, and the Zabbix Agent.
Add your user to the
dockergroup to run Docker commands withoutsudo.CONSOLEApply the group change to your current session.
CONSOLECreate the Docker Compose file.
CONSOLEAdd the following configuration:
YAMLSave and close the file.
The configuration defines the following services:
traefik: Handles all external web traffic on ports 80 and 443. It provisions and renews TLS certificates from Let's Encrypt and routes HTTPS requests to the Zabbix web interface using Docker labels.mysql-server: Runs MySQL 8.4 and stores all Zabbix configuration and monitoring data. Database credentials are read from the.envfile.zabbix-server: Collects metrics from agents, processes data, and evaluates alert triggers.zabbix-web: The Apache-based web frontend. Traefik routes HTTPS traffic from${DOMAIN}to port 8080 on this container.zabbix-agent: Monitors the local host and sends metrics tozabbix-server.
Start all services in detached mode.
CONSOLEVerify that all containers are running.
CONSOLEThe output displays five running containers: Traefik, MySQL, Zabbix Server, Zabbix Web, and Zabbix Agent.
Access the Zabbix Web Interface
The Zabbix web interface is accessible at the domain configured in the .env file after Traefik provisions the TLS certificate.
Open a web browser and navigate to the Zabbix web interface. Replace
zabbix.example.comwith the domain you set inDOMAIN.Log in using the default credentials.
- Username:
admin - Password:
zabbix
The Zabbix Global view dashboard loads after a successful login. It displays host availability, top hosts by CPU usage, system information, and any active alerts.
- Username:
Change the default admin password. Expand Users in the left sidebar and click Users.
Click Admin in the user list to open the user edit page.
Click the Change password button next to the Password field.
The page displays the Current password, Password, and Password (once again) fields.
Enter
zabbixin the Current password field.Enter a new secure password in the Password and Password (once again) fields.
Click Update to save the new password.
Verify Zabbix Is Running
Confirm that Zabbix is collecting data from the configured agent.
Navigate to Monitoring > Hosts from the left sidebar.
Check the
ZBXavailability badge for theZabbix serverhost.In Docker deployments, this badge appears red by default because Zabbix attempts to reach the agent at
127.0.0.1:10050— the server container's own loopback address, not the agent container's address. The next step fixes this.Update the agent interface to use the Docker service name instead of the loopback address.
- Click the host name Zabbix server in the Hosts list. A context menu appears.
- Under CONFIGURATION, click Host. The Host configuration dialog opens.
- In the Interfaces section, locate the Agent row. Change the Connect to option from IP to DNS and enter
zabbix-agentin the DNS name field. - Click Update.
The Hosts page displays a Host updated confirmation banner.
Refresh the Hosts page after a short while. The
ZBXbadge turns green, confirming the agent is connected and sending data to the server.Navigate to Monitoring > Latest data to view real-time metrics.
In the Hosts field, type
Zabbix server, select it from the results, then click Apply.CPU usage, memory consumption, and network traffic metrics appear in the list, confirming that Zabbix is collecting data from the agent.
Navigate to Dashboard to view the default dashboard. The dashboard shows one host available with a green status, confirming the monitoring setup is complete.
Conclusion
You have successfully deployed Zabbix on your Linux server using Docker Compose with Traefik providing automatic HTTPS through Let's Encrypt. The Zabbix Agent monitors the local host and reports CPU usage, memory consumption, and network traffic to the Zabbix Server. For more information, visit the official Zabbix documentation.


0 Comments
Be the first to comment and share your perspective with the community.