
How to Install Nagios on Debian 12
To install Nagios on Debian 12, you gain access to an open-source monitoring tool that tracks the status of network hosts, services, and applications. Nagios employs a server/agent architecture, where the Nagios Remote Plugin Executor (NRPE) agent communicates with remote hosts to monitor devices, system resources, and applications. It performs periodic checks on these tracked resources, returns status codes, and generates graphical reports through a web-based monitoring dashboard.
This article explains how to install Nagios on Debian 12 and configure it to perform monitoring tasks on a remote host.
Prerequisites
Before you begin, you need:
- At least two Debian 12 instances to use as the Nagios server, and remote host respectively.
Build and Compile Nagios Core
Nagios is not available in the default package repositories on Debian 12. Follow the steps below to build and compile the Nagios core package before installing it on your server.
Update the server's package index.
console$ sudo apt update
Install all required dependency packages for Nagios.
console$ sudo apt install -y apache2 php libapache2-mod-php php-gd php-mysql build-essential libgd-dev unzip libssl-dev wget curl autoconf gcc libc6 make apache2-utils
The above command installs the Apache web server, PHP, and necessary development packages required by Nagios to run on the server.
Switch to your user's home directory.
console$ cd
Create a new
nagios-tempproject directory to store Nagios files.console$ mkdir nagios-temp
Switch to the
nagios-tempdirectory.console$ cd nagios-temp
Visit the Nagios Core repository, verify, and download the latest Nagios core release package using
wget. For example, Nagios4.5.8.console$ wget https://github.com/NagiosEnterprises/nagioscore/releases/download/nagios-4.5.8/nagios-4.5.8.tar.gz
Extract files from the downloaded Nagios archive.
console$ tar xzf nagios-4.5.8.tar.gz
List files in your working directory and verify that a new Nagios directory is available.
console$ lsOutput:
nagios-4.5.8 nagios-4.5.8.tar.gzSwitch to the Nagios project directory.
console$ cd nagios-4.5.8
Run the Nagios
configurescript to create a new virtual host configuration in the/etc/apache2/sites-enableddirectory.console$ sudo ./configure --with-httpd-conf=/etc/apache2/sites-enabled
Compile Nagios core.
console$ sudo make all
Install Nagios on Debian 12
Follow the steps below to install Nagios and configure all necessary components including Apache modules to enable access to the Nagios web monitoring dashboard.
Print your working directory and verify the Nagios project directory path.
console$ pwd
Your output should be similar to the one below.
/home/linuxuser/nagios-4.5.8Install the Nagios user and group information.
console$ sudo make install-groups-users
Add the
www-datauser to thenagiosgroup to grant the Apache web server access to the Nagios web files.console$ sudo usermod -a -G nagios www-data
Install Nagios.
console$ sudo make install
Install the Nagios system daemon to manage the application as a system service.
console$ sudo make install-daemoninit
Install the command module to enable access to Nagios with external commands.
console$ sudo make install-commandmode
Install the Nagios system configurations.
console$ sudo make install-config
Install the Nagios web configurations.
console$ sudo make install-webconf
Enable the Apache rewrite module.
console$ sudo a2enmod rewrite
Activate the Apache CGI module to enable Nagios CGI scripts to serve dynamic web content.
console$ sudo a2enmod cgi
Create a new
nagiosadminbasic authentication user with a strong password.console$ sudo htpasswd -c /usr/local/nagios/etc/htpasswd.users nagiosadmin
Install Nagios Plugins
Nagios plugins include monitoring scripts that continuously track the health of network hosts and installed services. Plugins send all monitoring results to Nagios Core which processes the data to trigger specific actions on a host. Nagios Plugins perform tasks such as CPU usage monitoring, disk performance, and network latency monitoring. Follow the steps below to install the Nagios plugins on your server.
Switch to your user's home directory.
console$ cd
Visit the Nagios plugins release page and download the latest Nagios Core plugins release file. For example, download the
2.4.12Nagios plugins version.console$ wget https://github.com/nagios-plugins/nagios-plugins/releases/download/release-2.4.12/nagios-plugins-2.4.12.tar.gz
Extract files from the Nagios plugins archive.
console$ tar xzf nagios-plugins-2.4.12.tar.gz
List files in your working directory and verify that the new
nagios-pluginsdirectory is available.console$ lsOutput:
nagios-4.5.8 nagios-4.5.8.tar.gz nagios-plugins-2.4.12 nagios-plugins-2.4.12.tar.gzSwitch to the Nagios plugins directory.
console$ cd nagios-plugins-2.4.12
Run the following command to detect your server configuration, installed dependencies, and the required paths for compiling Nagios plugins.
console$ sudo ./configure
Compile the plugins.
console$ sudo make
Install Nagios plugins.
console$ sudo make install
Test the Nagios core configuration for errors.
console$ sudo /usr/local/nagios/bin/nagios -v /usr/local/nagios/etc/nagios.cfg
Your output should be similar to the one below.
Nagios Core 4.5.8
Copyright (c) 2009-present Nagios Core Development Team and Community Contributors
Copyright (c) 1999-2009 Ethan Galstad
Last Modified: 2024-11-19
License: GPL

....................
Total Warnings: 0
Total Errors:   0

Things look okay - No serious problems were detected during the pre-flight check
Start the Nagios system service.
console$ sudo systemctl start nagios
Enable the Nagios service to automatically start at boot.
console$ sudo systemctl enable nagios
Restart Apache to apply the Nagios virtual host configuration changes.
console$ sudo systemctl restart apache2
Access Nagios Web Monitoring Dashboard
Nagios listens for web connection requests on the HTTP port 80 by default. The Nagios web monitoring dashboard allows you to monitor network statistics, services, and remote hosts with real-time system performance reports, and alerts. Follow the steps below to allow network connections to the HTTP port 80 and access the Nagios web monitoring dashboard on your server.
View the UFW status and verify that the firewall is active.
console$ sudo ufw status
When the status is
inactive, allow SSH connections and start UFW on your server.console$ sudo ufw allow ssh && sudo ufw enable
Allow incoming connections to the HTTP port
80.console$ sudo ufw allow 80/tcp
Reload UFW to apply the firewall changes.
console$ sudo ufw reload
Access the
/nagiospath using your server's public IP address in a web browser such as Chrome.http://SERVER-IP/nagiosLog in to the Nagios web monitoring dashboard using the following credentials you set earlier.
- User:
nagiosadmin - Password:
<you set earlier during installation>
- User:
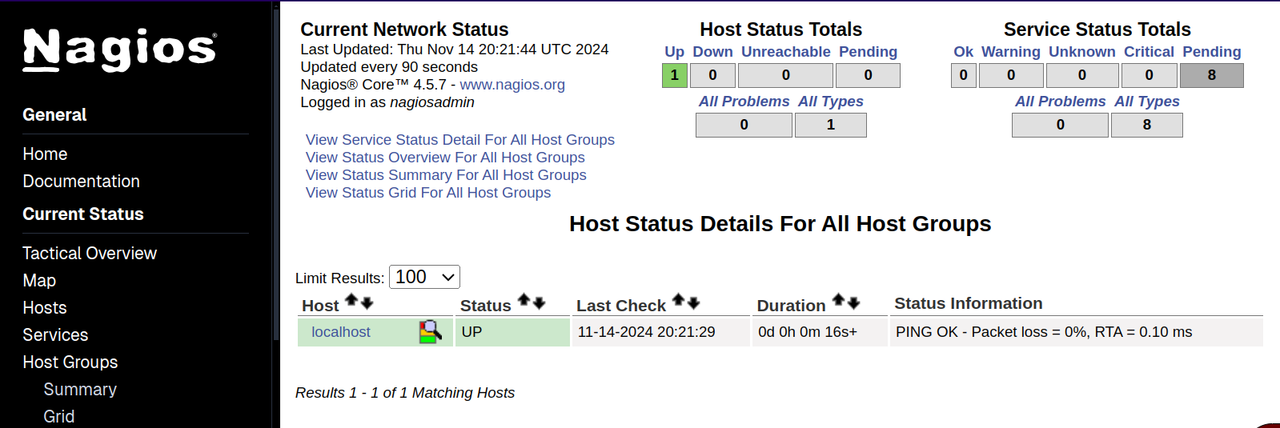
Verify that you can access the Nagios web monitoring dashboard.
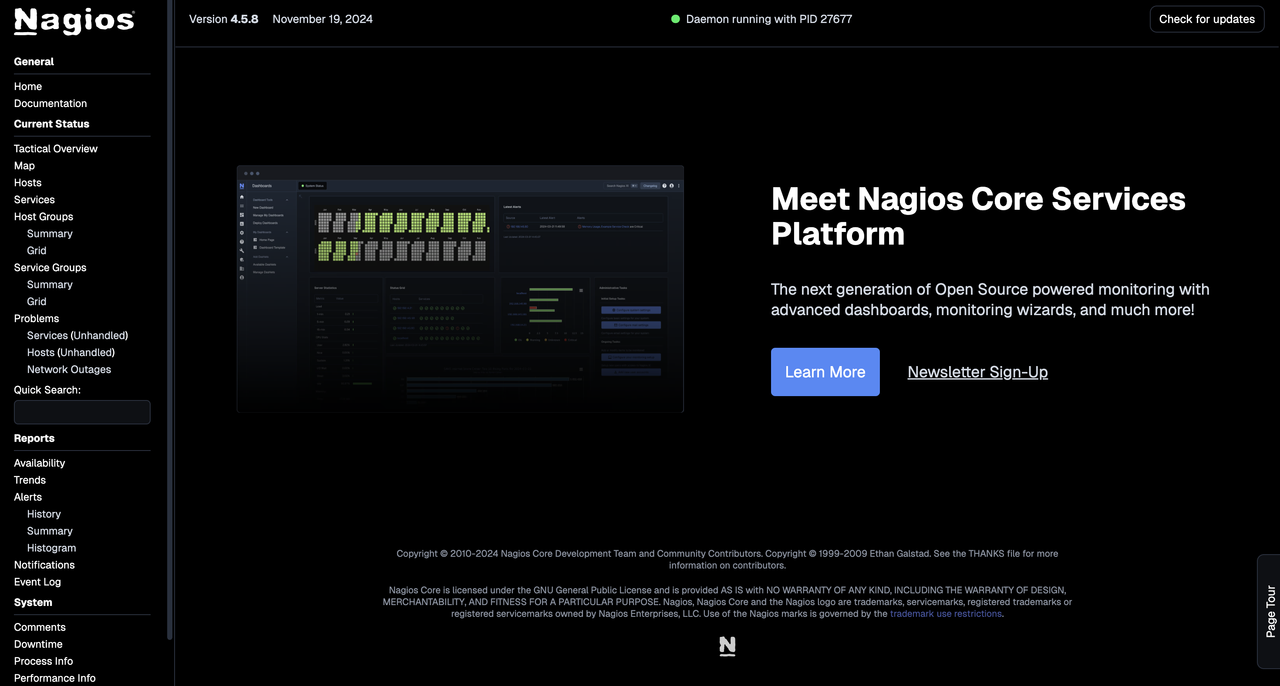
Navigate to Hosts on the left navigation menu to view the status of all active hosts linked to the Nagios server.
Configure Remote Host Monitoring
Nagios monitors remote hosts using the Nagios Remote Plugin Executor (NRPE) agent. NRPE listens for connection requests from the Nagios server to run predefined plugins on a remote host, enabling detailed checks on the CPU load, memory usage, disk space, and other resources. Follow the steps below to install NRPE on a separate Debian 12 client machine and configure Nagios to monitor the remote host.
Configure a Remote Host to Monitor
Follow the steps below to configure a remote host to monitor using the Nagios server.
Access your target remote host using SSH.
console$ ssh user@remotehost
Install the Nagios NRPE and
nagios-pluginspackages.console$ sudo apt install -y nagios-nrpe-server nagios-plugins
Open the NRPE configuration file using a text editor such as
nano.console$ sudo nano /etc/nagios/nrpe.cfg
Add the Nagios server's IP to the
allowed_hosts.iniallowed_hosts=127.0.0.1,nagios_server_ip
Add the following custom monitoring directive to the file.
inicommand[check_disk]=/usr/lib/nagios/plugins/check_disk -w 20% -c 10% -p /
Save and close the file.
The above
check_diskcommand checks for the disk usage on the root partition, and monitors it for warning (-w) and critical (-c) thresholds to send alerts to the Nagios server.Enable the NRPE service to automatically start at system boot.
console$ sudo systemctl enable nagios-nrpe-server
Restart the NRPE service to apply your configuration changes.
console$ sudo systemctl restart nagios-nrpe-server
Configure the Nagios Server to Monitor Remote Hosts
Follow the steps below to configure the Nagios server to monitor the remote host using its IP address.
Create a new directory to store the remote host configuration file.
console$ sudo mkdir -p /usr/local/nagios/etc/servers
Create a new
remote-host.cfgfile.console$ sudo nano /usr/local/nagios/etc/servers/remote-host.cfg
Add the following configurations to the file. Replace
Vultrwith your desired hostname and<remote_host_ip>with the remote host's IP address to monitor.inidefine host { use linux-server host_name Vultr alias Remote Server address <remote_host_ip> max_check_attempts 5 check_period 24x7 notification_interval 30 notification_period 24x7 }
Save and close the file.
Within the above configuration:
max_check_attempts: Sets the maximum number of check trials before marking the host as down.check_period: Sets the timeframe to perform host checks.notification_interval: Sets the interval (in minutes) between consecutive notifications.notification_period: Sets the timeframe to publish notifications in the Nagios dashboard.
Open the
nagios.cfgfile to enable the remote host configuration.console$ sudo nano /usr/local/nagios/etc/nagios.cfg
Add the following directive to the file.
inicfg_file=/usr/local/nagios/etc/servers/remote-host.cfg
Save and close the file.
The above directive enables the
remote-host.cfgconfiguration you created earlier to monitor the remote host on the Nagios server.Test the Nagios Core configuration for errors.
console$ sudo /usr/local/nagios/bin/nagios -v /usr/local/nagios/etc/nagios.cfg
Output:
Checking for circular paths...
        Checked 2 hosts
        Checked 0 service dependencies
        Checked 0 host dependencies
        Checked 5 timeperiods
Checking global event handlers...
Checking obsessive compulsive processor commands...
Checking misc settings...

Total Warnings: 0
Total Errors:   0

Things look okay - No serious problems were detected during the pre-flight check
Restart the Nagios service to apply the configuration changes.
console$ sudo systemctl restart nagios
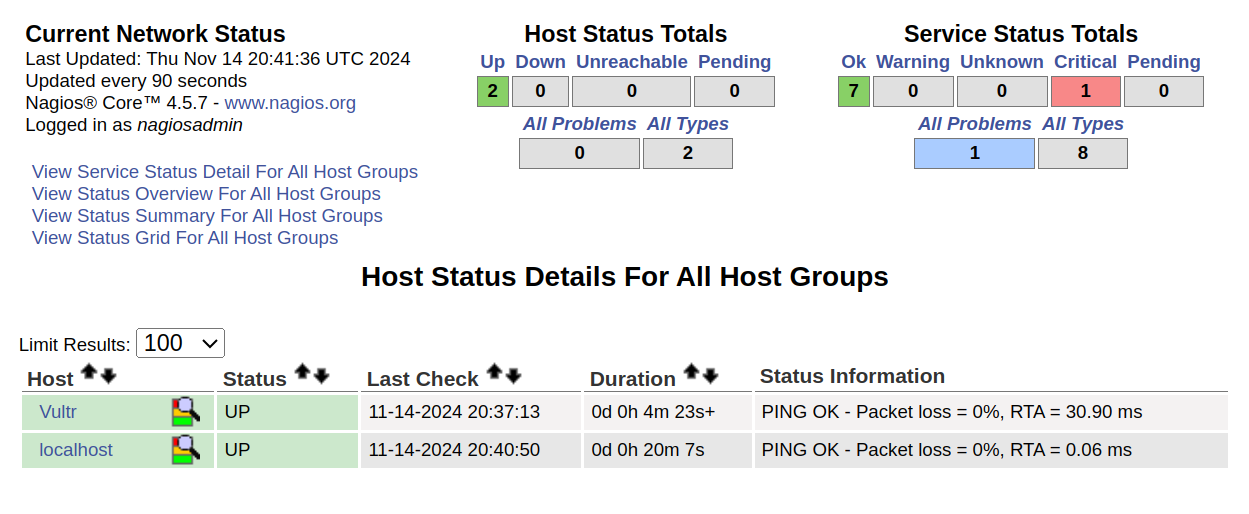
Access the Nagios web monitoring dashboard.
http://SERVER-IP/nagiosNavigate to the Hosts page to view and monitor the new remote host.
Conclusion
You have installed and configured Nagios on a Debian 12 server to monitor remote hosts. Nagios actively monitors the status of linked hosts and displays real-time usage statistics in the web monitoring dashboard. For more information and configuration options, please visit the Nagios documentation.