
How to Install Nagios on Rocky Linux 9
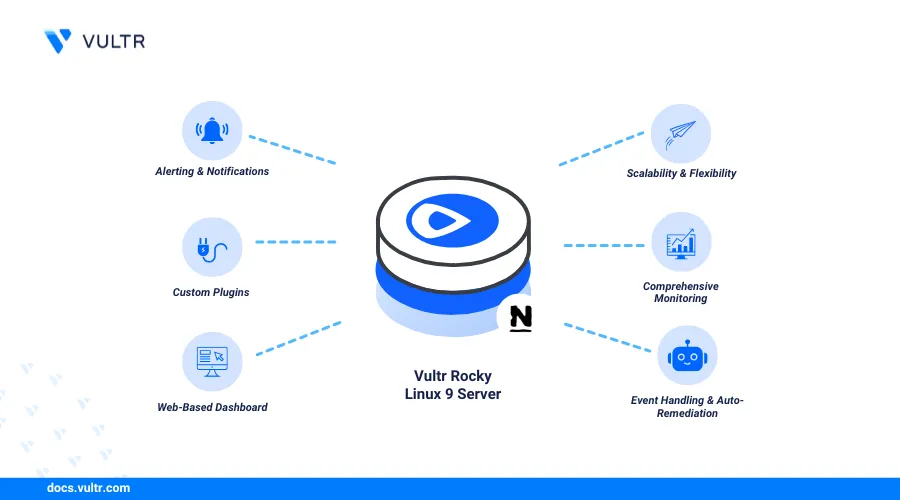
Nagios is a monitoring system that tracks the availability and performance of network services, servers, and applications. Installing Nagios on Rocky Linux 9 enables users to run scheduled service checks for HTTP, SSH, disk usage, and system processes using plugins. Nagios Core is the central component of the Nagios system, responsible for executing monitoring checks, managing configurations, and handling notifications. Nagios Core triggers alerts if a service or host experiences an issue, such as downtime or a performance threshold breach.
This article explains how to install Nagios on Rocky Linux. You'll also configure Nagios to monitor services on a remote host.
Prerequisites
Before you begin, you need to:
- Have access to a Rocky Linux server to use as the Nagios server as a non-root user with sudo privileges.
- Have access to an Ubuntu server instance to use as the Nagios client.
Compile and Install Nagios Core From Source
Nagios is not available in the default package repositories on Rocky Linux 9. Follow the steps below to compile and install the Nagios Core and its plugins.
Compile Nagios Core
Update the existing server packages.
console$ sudo dnf update -y
On your Nagios server, install all required dependency packages.
console$ sudo dnf install gcc glibc glibc-common wget perl net-snmp openssl-devel make unzip gd gd-devel epel-release httpd php php-cli php-common php-gd -y
This command installs compilers, libraries, and tools needed to compile Nagios Core and its plugins.
Navigate to the user's home directory.
console$ cd ~
Create a new
nagiosproject directory to store Nagios Core files.console$ mkdir nagios
Navigate to the directory.
console$ cd nagios
Visit the Nagios Core page and download the latest Nagios Core source code.
console$ wget https://assets.nagios.com/downloads/nagioscore/releases/nagios-4.5.9.tar.gz
Install
tarto extract the Nagios core.console$ sudo dnf install tar -y
Extract files from the downloaded archive.
console$ tar -xvf nagios-4.5.9.tar.gz
Navigate to the extracted plugins directory.
console$ cd nagios-4.5.9
Run the Nagios Core configuration script.
console$ ./configureCompile Nagios Core.
console$ make all
Compile and create a Nagios system user and group.
console$ sudo make install-groups-users
Your output should be similar to the one below:
groupadd -r nagios
useradd -g nagios nagios
Add the
apacheuser to the Nagios group to allow the Apache web server to interact with Nagios files and directories.console$ sudo usermod -a -G nagios apache
Install and Configure Nagios on Rocky Linux 9
Nagios Core consists of essential binaries, configuration files, and system services that enable monitoring capabilities. Follow these steps to install Nagios on Rocky Linux 9.
Install the core Nagios binaries.
console$ sudo make install
Install the init scripts required to start, stop, and manage Nagios as a service on your server.
console$ sudo make install-init
Install the Nagios command mode package to allow access to external web-based commands.
console$ sudo make install-commandmode
Install the default Nagios configuration files.
console$ sudo make install-config
Install the Apache configuration file to enable Nagios's web interface.
console$ sudo make install-webconf
Verify the Nagios configuration to ensure there are no errors.
console$ sudo /usr/local/nagios/bin/nagios -v /usr/local/nagios/etc/nagios.cfg
Your output should be similar to the one below:
...
Total Warnings: 0
Total Errors: 0

Things look okay - No serious problems were detected during the pre-flight check
Create a new
vultr-adminuser to access the web interface and set a strong password when prompted.console$ sudo htpasswd -c /usr/local/nagios/etc/htpasswd.users vultr-admin
Your output should be similar to the one below:
Adding password for user vultr-adminGrant Apache access to the Nagios authentication file.
console$ sudo chown apache:nagios /usr/local/nagios/etc/htpasswd.users
This allows the Apache web server to read the authentication credentials for the Nagios web interface.
Start the Nagios service.
console$ sudo systemctl start nagios
Your output should be similar to the one below:
Created symlink /etc/systemd/system/multi-user.target.wants/nagios.service → /usr/lib/systemd/system/nagios.service.Enable Nagios to start automatically on system boot.
console$ sudo systemctl enable nagios
Verify the Nagios service is up and running.
console$ sudo systemctl status nagios
Your output should be similar to the one below:
● nagios.service - Nagios Core 4.5.9
   Loaded: loaded (/usr/lib/systemd/system/nagios.service; enabled; preset: disabled)
   Active: active (running) since Sun 2025-02-16 06:05:12 UTC; 14s ago
     Docs: https://www.nagios.org/documentation
 Main PID: 74321 (nagios)
    Tasks: 6 (limit: 23116)
   Memory: 5.9M
      CPU: 321ms
Allow HTTP traffic on port 80 through the firewall.
console$ sudo firewall-cmd --add-service=http --permanent
Output:
successReload the firewall to apply the new rules.
console$ sudo firewall-cmd --reload
Enable Apache to start automatically when the system boots.
console$ sudo systemctl enable httpd
Restart both Nagios and Apache to apply the changes.
console$ sudo systemctl restart nagios httpd
Install Nagios Plugins
Nagios plugins allow Nagios to monitor various services, hosts, and resources. They acts as an executable script or binary that checks the status of a specific service or system component and returns the results to the Nagios core. Follow the steps below to install Nagios plugins.
Navigate to the Nagios directory you created.
console$ cd ~/nagios/
Visit the the Nagios plugins page and download the latest Nagios plugins source code.
console$ wget https://nagios-plugins.org/download/nagios-plugins-2.4.11.tar.gz
Extract files from the downloaded archive.
console$ tar -xvf nagios-plugins-2.4.11.tar.gz
Navigate to the extracted plugins directory.
console$ cd nagios-plugins-2.4.11
Run the Nagios plugins configuration script.
console$ ./configureCompile the plugins.
console$ makeInstall the compiled plugins.
console$ sudo make install
Restart both Nagios and Apache to apply the changes.
console$ sudo systemctl restart nagios httpd
Access the Nagios Web Monitoring Dashboard
Follow the steps below to access the Nagios web monitoring dashboard using your Nagios server's public IP address.
Open a new tab in web browser and enter the following URL to access the Nagios web interface.
http://<your-server-ip>/nagiosReplace
<your-server-ip>with the actual IP address of your Rocky Linux server.Enter the username
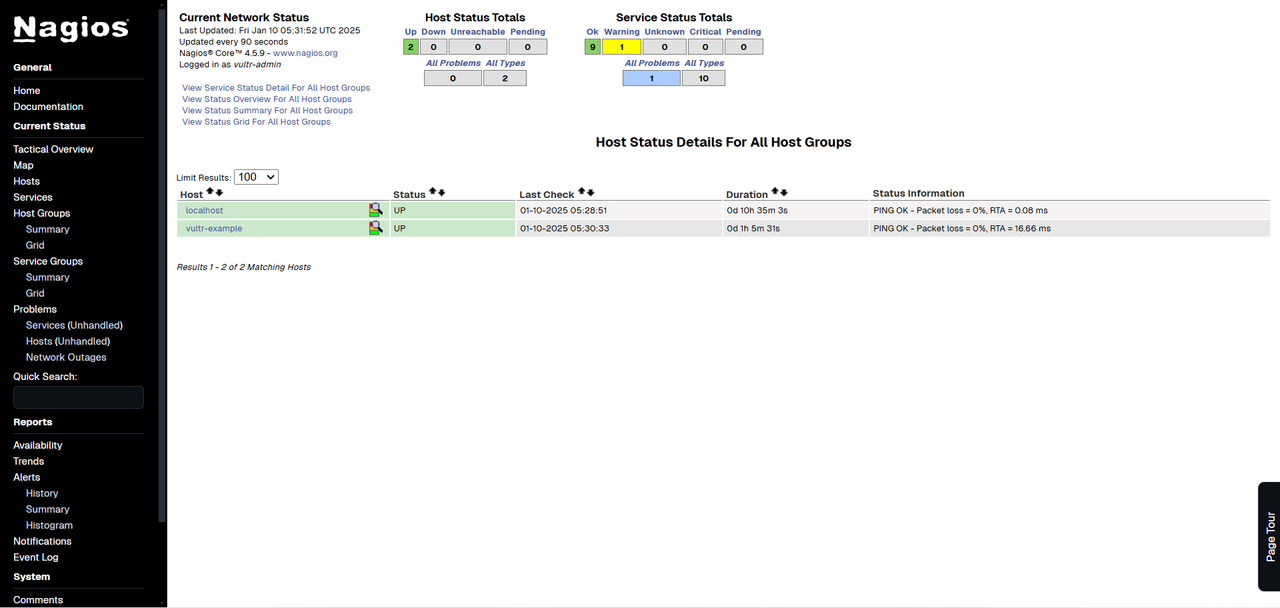
vultr-adminand the password you configured. After logging in, the Nagios dashboard appears, as shown in the image below.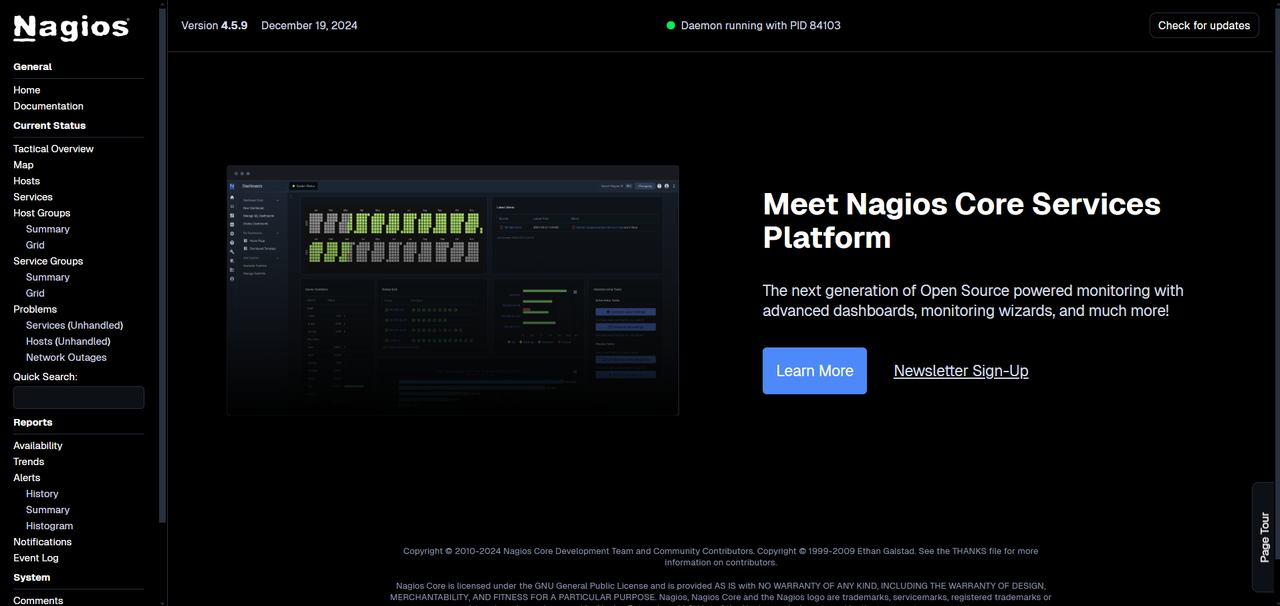
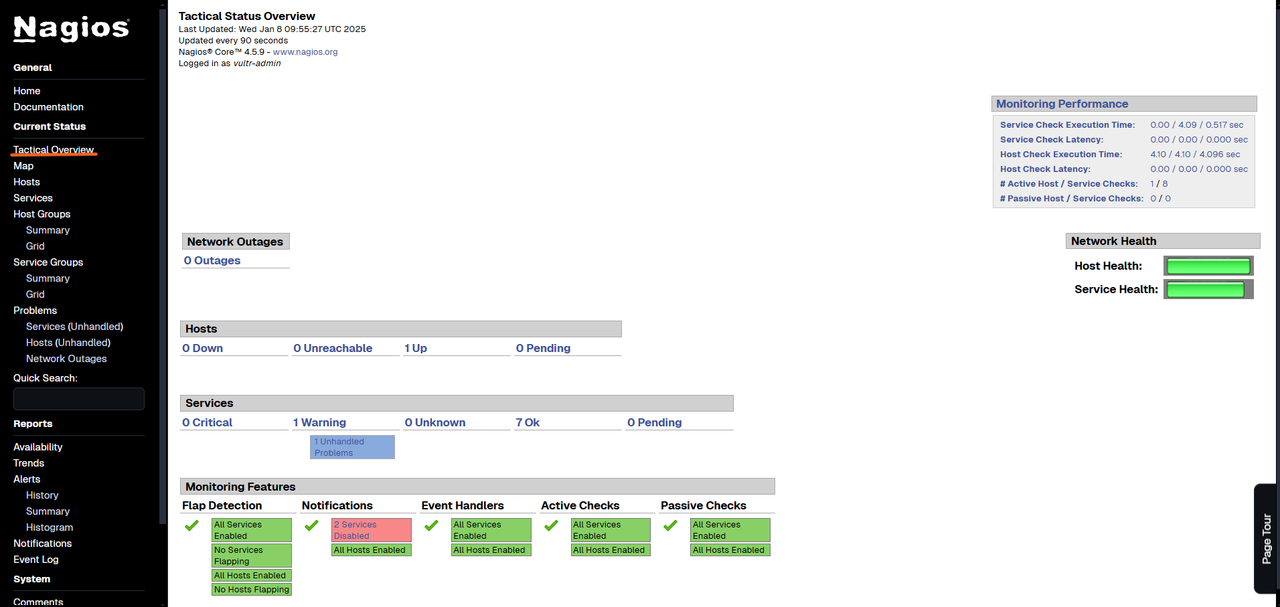
On the dashboard, navigate to side menu and click Tactical Overview to view a summary of monitored hosts, services, monitoring performance, and active alerts.
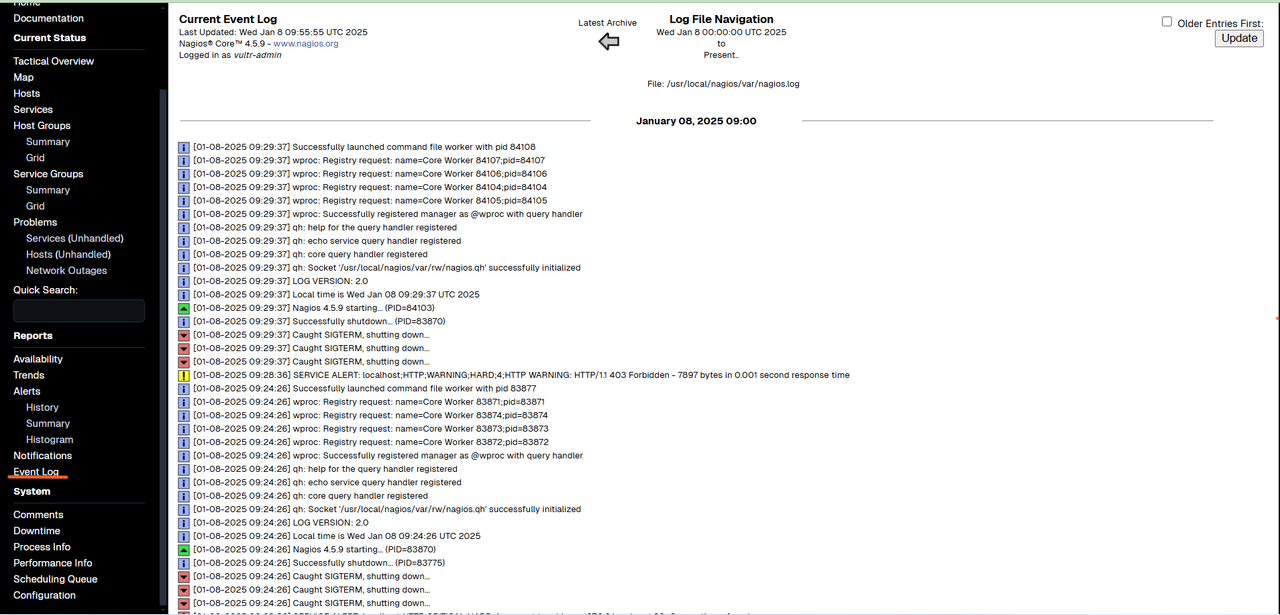
Click Event Log to check logs for events such as alerts, outages, and recovery logs.
Monitor Remote Hosts
Nagios enables you to monitor servers, routers, and other networked devices by defining them as hosts. The Nagios Remote Plugin Executor (NRPE) extends Nagios monitoring capabilities to remote hosts. It allows Nagios to execute plugins on remote machines, providing system metrics and resource monitoring when direct access is restricted.
Install Nagios Plugins on a Remote Host
Before Nagios can monitor a remote host, NRPE must be installed on it. NRPE listens for connection requests from a Nagios server, allowing remote monitoring of system metrics and resources. Follow the steps below to configure NRPE on your remote host.
Update the APT package index.
console$ sudo apt update
Install Nagios Remote Plugin Executor (NRPE) and Nagios plugins.
console$ sudo apt install -y nagios-nrpe-server nagios-plugins nagios-plugins-basic nagios-nrpe-plugin
Open the NRPE configuration file using a text editor, such as
vi.console$ sudo vi /etc/nagios/nrpe.cfg
Locate the
allowed_hostsdirective and add your Nagios server’s IP address.iniallowed_hosts=127.0.0.1,::1,<nagios-server-ip>
Replace
<nagios-server-ip>with the actual IP address of your Nagios server.Start NRPE server.
console$ sudo systemctl start nagios-nrpe-server
Enable NRPE to start at boot.
console$ sudo systemctl enable nagios-nrpe-server
Check NRPE service status.
console$ sudo systemctl status nagios-nrpe-server
Your output should be similar to the one below:
● nagios-nrpe-server.service - Nagios Remote Plugin Executor
     Loaded: loaded (/usr/lib/systemd/system/nagios-nrpe-server.service; enabled; preset: enabled)
     Active: active (running) since Sun 2025-02-16 06:46:33 UTC; 4min 23s ago
       Docs: http://www.nagios.org/documentation
   Main PID: 2726 (nrpe)
      Tasks: 1 (limit: 4607)
     Memory: 1.0M (peak: 1.2M)
        CPU: 7ms
View the UFW status and verify that the firewall is active.
console$ sudo ufw status
If the status is
inactive, allow SSH connections to the server and start UFW.console$ sudo ufw allow ssh && sudo ufw enable
The NRPE service listens on port
5666. Allow inbound connections on this port.console$ sudo ufw allow 5666/tcp
Output:
Rule added
Rule added (v6)
Reload UFW to apply the changes.
console$ sudo ufw reload
Output:
Firewall reloaded
Configure the Nagios Server To Monitor Remote Hosts
Follow the steps below to configure your Nagios server to monitor the remote host.
Install NRPE plugin.
console$ sudo dnf install -y nagios-plugins-nrpe
Open the Nagios command configuration file.
console$ sudo vi /usr/local/nagios/etc/objects/commands.cfg
Add the following custom command definition to the file.
inidefine command { command_name check_nrpe command_line /usr/lib64/nagios/plugins/check_nrpe -H $HOSTADDRESS$ -c $ARG1$ }
This command definition allows the Nagios server to connect to the NRPE agent on a remote host, request the execution of specific monitoring plugins, and retrieve the results.
Save and close the file.
In the above configuration:
command_name: The name (check_nrpe) that Nagios uses to reference this command.command_line: The actual command executed by Nagios, where:/usr/lib64/nagios/plugins/check_nrperuns the check_nrpe plugin.-H $HOSTADDRESS$specifies the target host's address.-c $ARG1$specifies the command for the remote host's NRPE agent to execute.
The NRPE service listens on port
5666. Allow inbound connections on this port.console$ sudo firewall-cmd --add-port=5666/tcp --permanent
Output:
successReload the firewall to apply the changes.
console$ sudo firewall-cmd --reload
Output:
successCreate a new
hostsconfiguration file for the remote host.console$ sudo vi /usr/local/nagios/etc/objects/hosts.cfg
Add the following configuration to define the
contactresponsible for receiving notifications about host or service issues.inidefine contact { use generic-contact contact_name <vultr-admin> alias <Vultr Admin> email <vultradmin@example.com> }
In the above configuration:
use generic-contact: Inherits properties from a pre-definedgeneric-contacttemplate.contact_name vultr-admin: Assigns the namevultr-adminto the contact.alias Vultr Admin: Provides a descriptive labelVultr Admin, for the contact.email vultradmin@example.com: Specifies the email address for sending notifications.
Feel free to replace the
contact_name,alias, andemailvalues with your information.Add the following configuration to create a
hostblock for a specific device to be monitored by Nagios.inidefine host { use linux-server host_name vultr-example address <ip-address> max_check_attempts 5 check_period 24x7 notification_interval 30 notification_period 24x7 }
In the above configuration:
use linux-server: Applies the default settings from thelinux-servertemplate for standard Linux configurations.host_name vultr-example: Sets a unique identifier for the host. Replacevultr-examplewith your hostname.address <ip-address>: Specifies the IP address of the host to be monitored. Replace<ip-address>with the actual IP.max_check_attempts 5: Retries failed checks up to 5 times before marking the host as down.check_period 24x7: Specifies that checks are performed24hours a day,7days a week.notification_interval 30: Sends notifications every 30 minutes during a problem state.notification_period 24x7: Defines when Nagios will send notifications,24hours a day,7days a week.
Define Service Monitoring in Nagios
The following configurations define service checks for the vultr-example host to monitor SSH connectivity, system load, and total processes.
Add the following configuration to monitor for SSH connectivity for the
vultr-examplehost.inidefine service { use generic-service host_name vultr-example service_description SSH check_command check_ssh max_check_attempts 3 check_interval 2 retry_interval 1 }
In the above configuration:
- Monitors SSH using the
check_sshplugin. - Retries failed checks 3 times before marking the service as down.
- Runs checks every 2 minutes, with a 1-minute retry interval.
- Monitors SSH using the
Add the following configuration to define a System Load check for the
vultr-examplehost to monitor its load levels.inidefine service { use generic-service host_name vultr-example service_description System Load check_command check_nrpe!check_load max_check_attempts 5 check_interval 2 retry_interval 1 }
In the above configuration:
- Uses the NRPE plugin to monitor system load.
- Retries failed checks 5 times before marking the service as down.
- Runs checks every 2 minutes, with a 1-minute retry interval.
Add the configuration below to define a Total Processes check for the
vultr-examplehost to monitor the total number of processes running on the system.inidefine service { use generic-service host_name vultr-example service_description Total Processes check_command check_nrpe!check_total_procs max_check_attempts 5 check_interval 2 retry_interval 1 }
In the above configuration:
- Uses the NRPE plugin to monitor total running processes.
- Retries failed checks 5 times before marking the service as down.
- Runs checks every 2 minutes, with a 1-minute retry interval.
Save and close the file.
Open Nagios configuration file with a text editor such as
vi.console$ sudo vi /usr/local/nagios/etc/nagios.cfg
Add the following line to include the
hosts.cfgfile during startup.ini# Definitions for monitoring remote host cfg_file=/usr/local/nagios/etc/objects/hosts.cfg
Save and close the file.
Verify the Nagios configuration to ensure there are no errors.
console$ sudo /usr/local/nagios/bin/nagios -v /usr/local/nagios/etc/nagios.cfg
Your output should be similar to the one below:
...
Total Warnings: 0
Total Errors: 0

Things look okay - No serious problems were detected during the pre-flight check
Restart Nagios to apply the changes.
console$ sudo systemctl restart nagios
Verify Remote Host and Service Monitoring
In the Nagios Dashboard, navigate to the side menu and click Hosts. The newly configured remote host should appear in the list with a status of UP, indicating that the host is operational and accessible by the Nagios server.
Click the
vultr-examplehost to view the Host State Information page.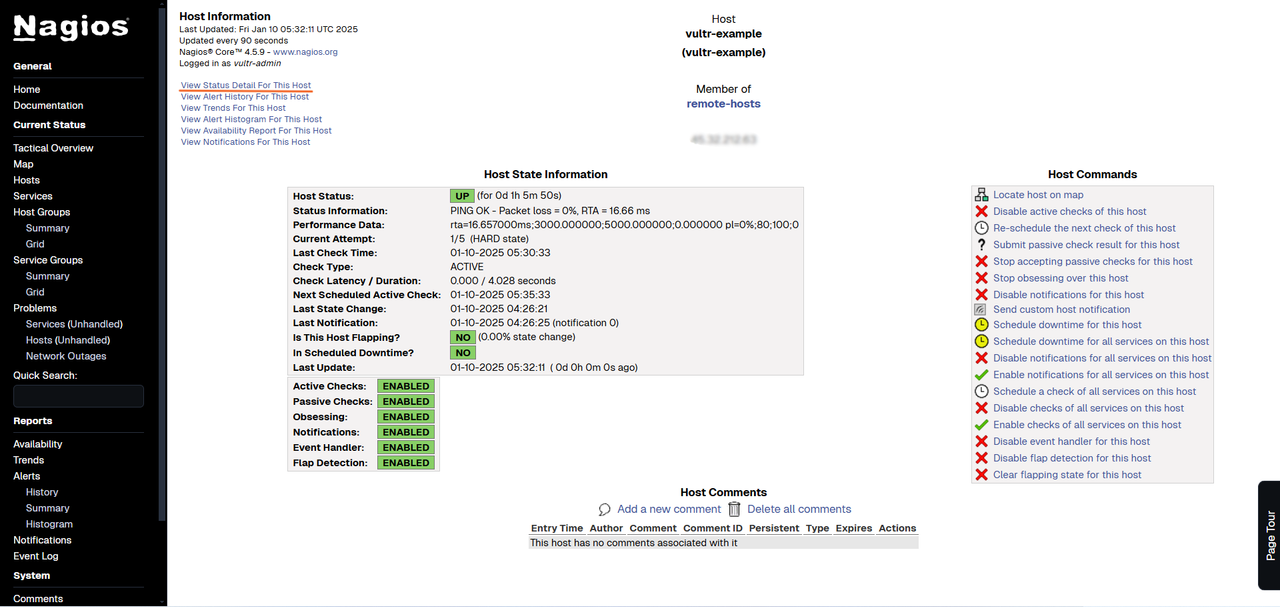
This section provides detailed status information about the remote host.
Click View Status Detail For This Host in the Host State Information section to see the monitored services for
vultr-example. Services with an OK status indicate successful checks.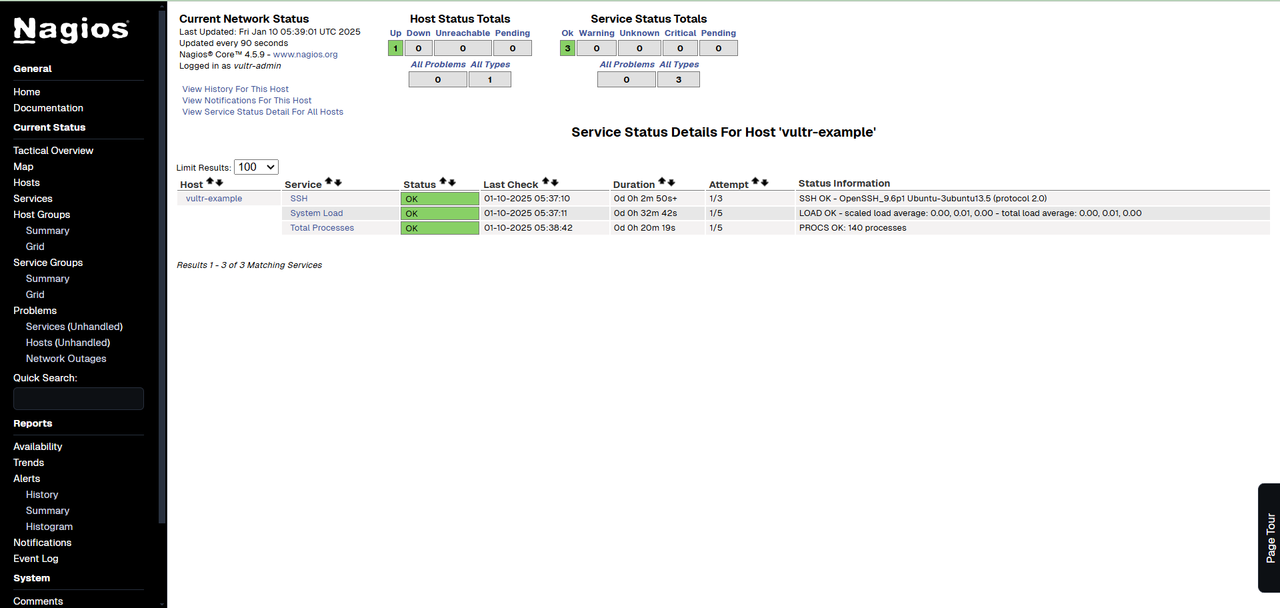 Initially, statuses may show as PENDING due to a 2-minute check interval. Nagios updates statuses after the next scheduled check.Note
To view all monitored services, navigate to the Services option in the side menu. The displayed information includes
localhost, representing your Rocky Linux server and its monitored services, as well as the remote hostvultr-exampleand its monitored services.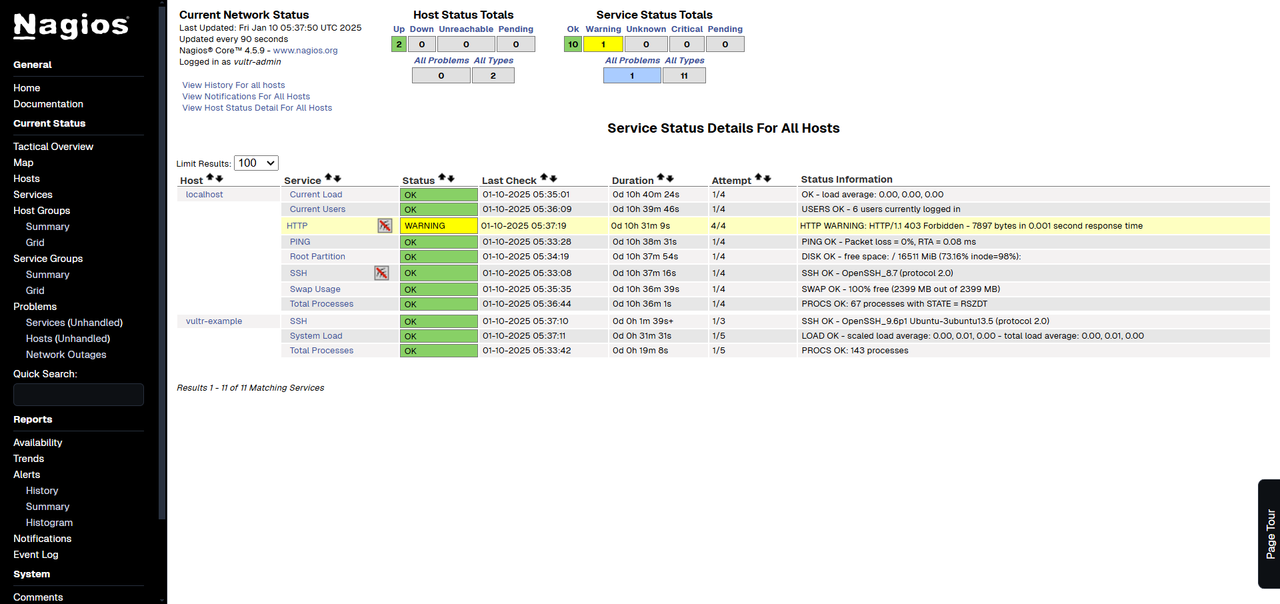
Conclusion
You have successfully installed the Nagios on Rocky Linux, set up Nagios plugins, and configured remote host monitoring. With Nagios running, you can extend its capabilities by adding more hosts and services as needed. For enhanced monitoring, use the Nagios NRPE package on remote hosts and configure settings accordingly. For more information on Nagios, visit the official documentation.