How to Deploy Grafana – Metrics Visualization Platform
Grafana is an open-source analytics and visualization platform designed for observability and monitoring. It connects to data sources and renders interactive dashboards and graphs, while also generating alerts to help you visualize and analyze metrics, logs, and traces from your infrastructure and applications in real-time.
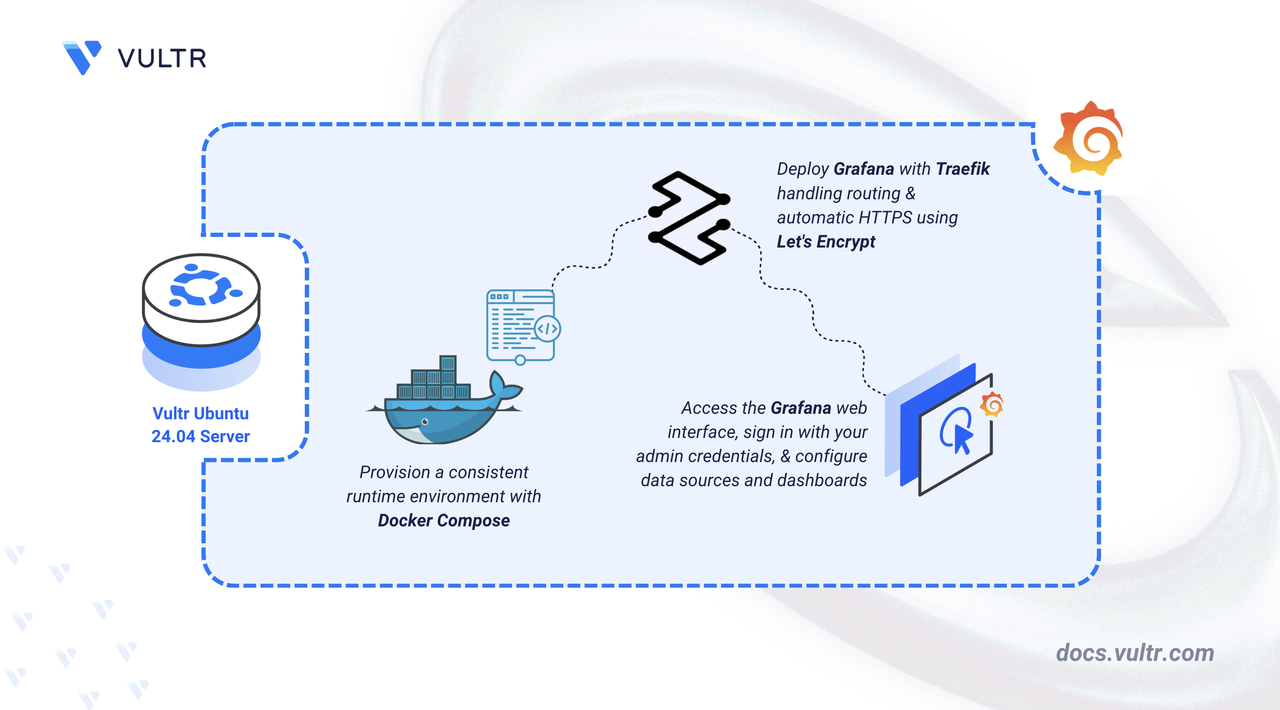
In this article, you will deploy Grafana using Docker Compose, configure persistent storage for dashboard and plugin data, and set up Traefik as a reverse proxy to securely access your Grafana instance.
Prerequisites
Before you begin, you need to:
- Have access to an Ubuntu 24.04-based server as a non-root user with
sudoprivileges. - Install Docker and Docker Compose.
- Configure a domain A record pointing to your server's IP address (for example,
grafana.example.com).
Set Up the Directory Structure and Environment Variables
In this section, you prepare the required directory structure for Grafana and define environment variables in a .env file.
Create the directory structure for Grafana.
CONSOLEThis directory stores Grafana's database, dashboards, plugins, and configuration files.
Navigate into the
grafana-monitoringdirectory.CONSOLESet proper ownership for the Grafana data directory. Grafana runs as the
grafanauser (UID 472) inside the container.CONSOLECreate a
.envfile.CONSOLEAdd the following variables:
INIReplace:
grafana.example.comwith your domain.admin@example.comwith your email.changemewith a strong password.
Save and close the file.
Deploy with Docker Compose
In this section, you create and deploy the Docker Compose stack that runs Grafana behind Traefik. Docker Compose manages both containers, applies the environment variables from your .env file, and automatically configures HTTPS routing through Traefik.
Create a new Docker Compose manifest.
CONSOLEAdd the following content.
YAMLSave and close the file.
This deployment specification includes:
- services: Two containers form the visualization stack:
- traefik: Processes incoming HTTP/HTTPS requests, handles certificate management, and routes connections to Grafana.
- grafana: Hosts the dashboard interface and generates visual representations of data.
- image: Specifies the Docker images for each service.
- container_name: Persistent naming conventions facilitate operational tasks including log review and service management.
- command (Traefik): Configures operational behavior including Docker integration, dual-port listening (80/443), protocol redirection from HTTP to HTTPS, and Let's Encrypt certificate automation using HTTP challenge mechanisms.
- ports (Traefik): Maps host ports 80 and 443 to enable external client connectivity.
- expose (Grafana): Provides internal network access on port 3000 for Traefik routing without creating public exposure.
- volumes:
- The bind mount (
./grafana-data) maintains persistent storage for application databases, dashboard configurations, and installed plugins. - Certificate data persists in the
letsencryptnamed volume across service restarts. - Read-only Docker socket access (
/var/run/docker.sock) allows Traefik to dynamically detect running containers.
- The bind mount (
- environment (Grafana): References domain and admin password from the
.envfile for public-facing URL configuration and initial credentials. - labels (Grafana): Traefik configuration annotations that enable request forwarding, define hostname-based routing, and specify the TLS certificate provider.
- restart: unless-stopped: Ensures containers restart automatically following system events unless explicitly stopped by administrators.
- services: Two containers form the visualization stack:
Create and start the services.
CONSOLEVerify that the services are running.
CONSOLEOutput:
Both containers are running successfully. Grafana is ready to render dashboards while Traefik accepts connections on ports
80and443.View the logs of the services.
CONSOLEFor more information on managing a Docker Compose stack, see the How To Use Docker Compose article.
Access Grafana
In this section, you access the Grafana web interface and verify your installation by exploring the default interface and available features.
Open the Grafana web interface in your browser.
Sign in with the default credentials:
- Username:
admin - Password: The password you set in the
.envfile
- Username:
The Grafana home page displays after login. Explore the main interface sections:
- Click Connections > Data sources to access the data source management page, where you can add monitoring backends like Prometheus, Loki, or other data sources.
- Click Dashboards to access the dashboard library where you can create and manage visualizations.
- Click Explore to access the query editor for ad-hoc data exploration.
Verify your Grafana version and build information. Click the question mark icon
?in the top-right corner to open the Help menu. The version and build number appear at the top of the menu (for example,Grafana v12.3.0).
Conclusion
You have successfully deployed Grafana for monitoring visualization with production-ready HTTPS security. The containerized deployment maintains dashboard configurations and application state through persistent volumes, while automated certificate management ensures continuous secure access. With Traefik handling SSL termination and traffic routing, Grafana stands ready to connect with observability backends including Prometheus, Loki, Tempo, and Mimir, transforming raw telemetry into actionable visual insights through customizable dashboards.


0 Comments
Be the first to comment and share your perspective with the community.