How to Deploy Mimir – Scalable Metrics Storage
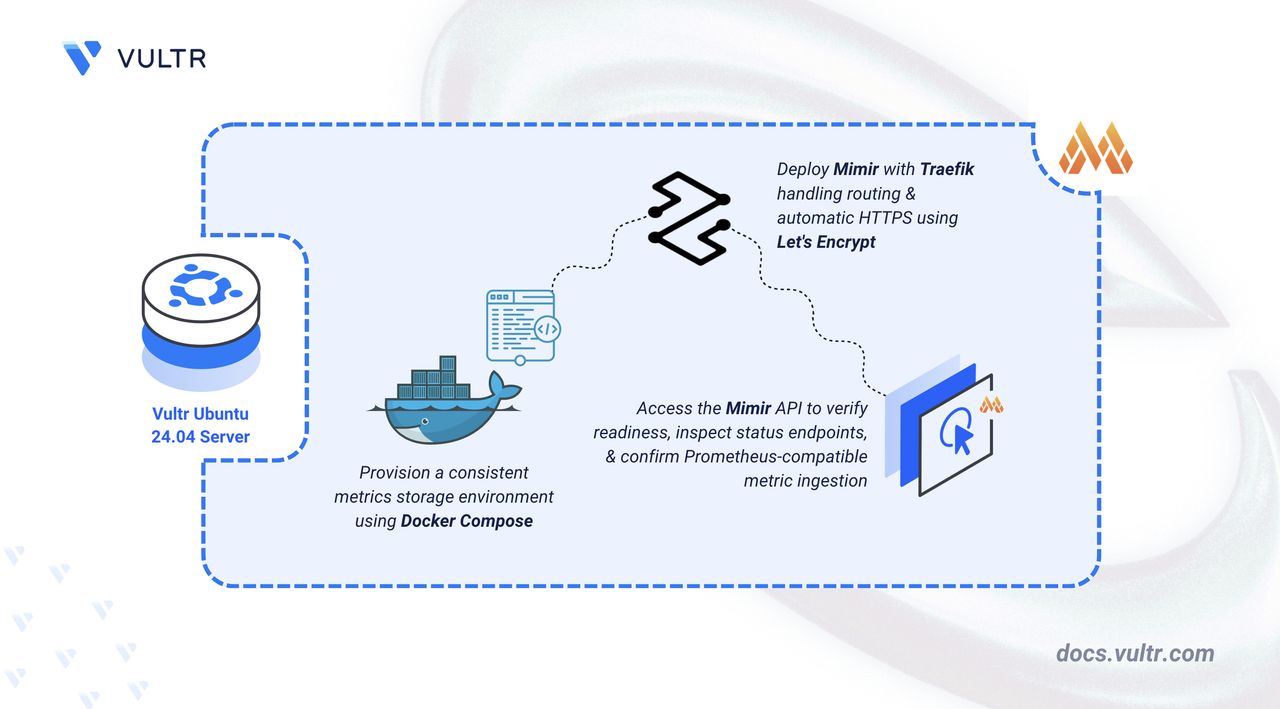
Mimir is an open-source, horizontally scalable time-series database designed for long-term storage of Prometheus metrics. Developed by Grafana Labs, it provides high availability, multi-tenancy, and seamless integration with Prometheus and Grafana. Mimir enables organizations to store and query billions of active time series while maintaining fast query performance across months or years of historical data.
In this article, you will deploy Mimir using Docker Compose, configure persistent storage for metrics data, and set up Traefik as a reverse proxy to securely access your Mimir instance.
Prerequisites
Before you begin, you need to:
- Have access to an Ubuntu 24.04-based server as a non-root user with
sudoprivileges. - Install Docker and Docker Compose.
- Configure a domain A record pointing to your server's IP address (for example,
mimir.example.com).
Set Up the Directory Structure and Environment Variables
In this section, you prepare the required directory structure for Mimir and define environment variables in a .env file.
Create the directory structure for Mimir.
CONSOLEThese directories store time-series blocks, WAL files, and configuration settings.
Navigate into the
mimir-metricsdirectory.CONSOLECreate a
.envfile.CONSOLEAdd the following variables:
INIReplace:
mimir.example.comwith your domain.admin@example.comwith your email.
Save and close the file.
Create a Mimir configuration file.
CONSOLEAdd the following content.
YAMLSave and close the file.
This configuration establishes single-node operation with filesystem storage. The
memberlistkey-value store handles internal coordination, whileblocks_storagemanages the time-series database with local persistence. Setting limits to0removes ingestion restrictions for development deployments.
Deploy with Docker Compose
In this section, you create and deploy the Docker Compose stack that runs Mimir behind Traefik. Docker Compose manages both containers, applies the environment variables from your .env file, and automatically configures HTTPS routing through Traefik.
Create a new Docker Compose manifest.
CONSOLEAdd the following content.
YAMLSave and close the file.
This deployment manifest includes:
- services: Two containers constitute the metrics storage platform:
- traefik: Manages incoming connections, provisions SSL certificates automatically, and forwards requests to Mimir.
- mimir: Executes the time-series database engine and exposes Prometheus-compatible APIs.
- image: Container images are sourced from Grafana Labs' official Docker Hub repository.
- container_name: Descriptive naming conventions simplify administrative tasks and log analysis.
- command (Traefik): Establishes Docker provider settings, configures HTTP/HTTPS entry points on ports 80 and 443, enables automatic protocol redirection, and activates Let's Encrypt certificate automation via HTTP-01 challenge.
- command (Mimir): Specifies the configuration file path within the container environment.
- ports (Traefik): Binds standard web ports for external client connectivity.
- expose (Mimir): Opens port 9009 within the Docker network for internal routing without public exposure.
- volumes:
- Configuration and data directories preserve settings and time-series blocks through container recreation.
- The
letsencryptnamed volume maintains certificate persistence across service restarts. - Docker socket mounting enables Traefik to detect running containers for dynamic routing.
- labels (Mimir): Traefik annotations that activate proxy functionality, define hostname-based routing rules, attach SSL certificates, and declare the backend service port.
- restart: unless-stopped: Ensures automatic service recovery following system events unless explicitly stopped.
- services: Two containers constitute the metrics storage platform:
Create and start the services.
CONSOLEVerify that the services are running.
CONSOLEOutput:
Both containers are running. Mimir accepts metrics while Traefik handles connections on ports
80and443.View the logs of the services.
CONSOLEFor more information on managing a Docker Compose stack, see the How To Use Docker Compose article.
Access Mimir
This section demonstrates accessing the Mimir API to verify your installation by checking service health and querying the Prometheus-compatible endpoints.
Check the service readiness endpoint.
CONSOLEOutput:
This confirms Mimir has initialized successfully and is accepting requests.
Verify Mimir build information.
CONSOLEOutput displays version details, confirming the API is responding correctly.
Query the current configuration.
CONSOLEOutput returns the active configuration in YAML format, confirming Mimir loaded your settings properly.
Check ingester ring status.
CONSOLEOutput displays the internal ring status showing this node as active and ready to receive metrics.
Conclusion
You have successfully deployed Mimir for long-term metrics storage with HTTPS encryption. The Docker Compose architecture pairs the time-series database with automated SSL certificate management, while persistent volumes maintain your metrics data through container updates and restarts. Traefik handles secure traffic routing and certificate renewal seamlessly. Your Mimir instance is ready to receive metrics from Prometheus instances via remote write, store historical data efficiently, and serve PromQL queries for visualization in Grafana dashboards.


0 Comments
Be the first to comment and share your perspective with the community.