How to Deploy Prometheus – Metrics Collection Server
Prometheus is an open-source monitoring and alerting toolkit designed for reliability and scalability. It collects and stores metrics as time-series data with timestamps and optional labels, enabling powerful querying and analysis of your infrastructure and applications.
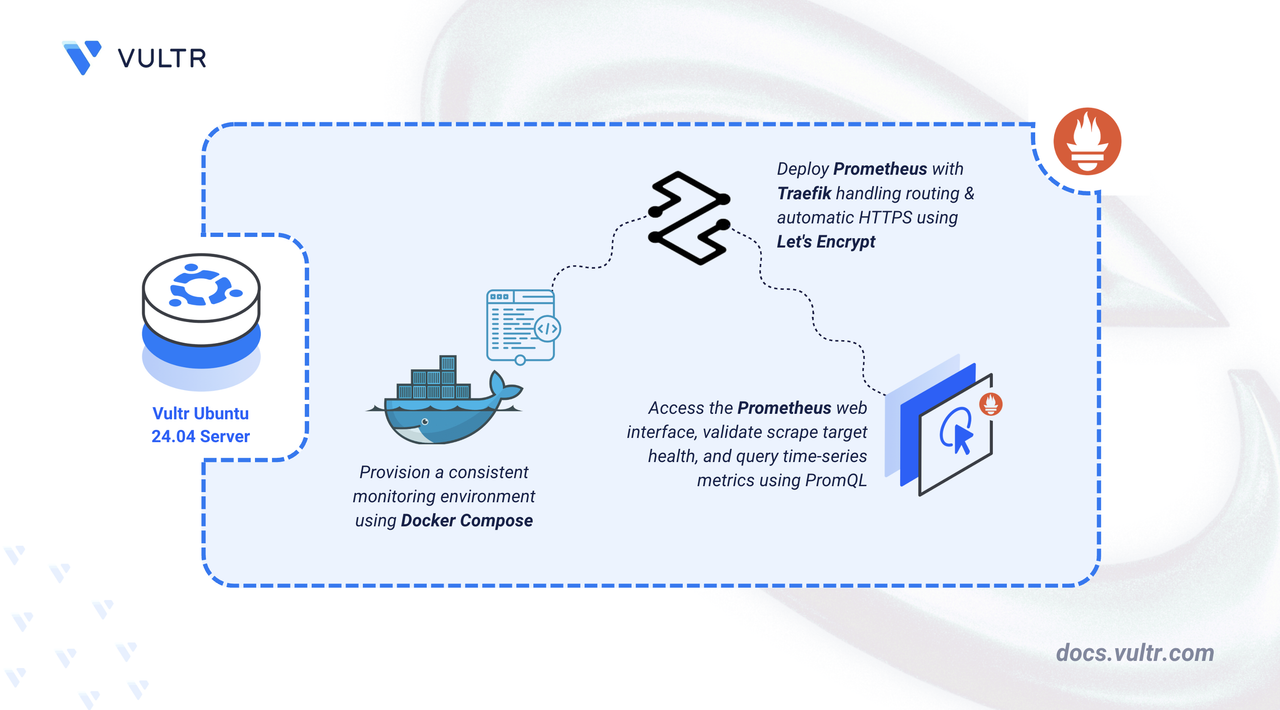
In this article, you will deploy Prometheus using Docker Compose, configure persistent storage for metrics data, and set up Traefik as a reverse proxy to securely access your Prometheus instance.
Prerequisites
Before you begin, you need to:
- Have access to an Ubuntu 24.04-based server as a non-root user with
sudoprivileges. - Install Docker and Docker Compose.
- Configure a domain A record pointing to your server's IP address (for example,
prometheus.example.com).
Set Up the Directory Structure and Environment Variables
In this section, you prepare the required directory structure for Prometheus and define environment variables in a .env file.
Create the directory structure for Prometheus.
CONSOLEThese directories serve different purposes:
- prometheus-data: Contains the time-series database where metrics are stored.
- prometheus-config: Stores YAML configuration files for Prometheus.
Navigate into the
prometheus-monitoringdirectory.CONSOLESet proper ownership for the Prometheus data directory. Prometheus runs as the
nobodyuser (UID 65534) inside the container.CONSOLECreate a
.envfile.CONSOLEAdd the following variables:
INIReplace:
prometheus.example.comwith your domain.admin@example.comwith your email.
Save and close the file.
Create a Prometheus configuration file.
CONSOLEAdd the following content.
YAMLSave and close the file.
The configuration includes:
- global: Sets the default intervals that control how often Prometheus scrapes metrics from targets and evaluates recording and alerting rules (every 15 seconds).
- scrape_configs: Defines which targets to scrape metrics from. Here, Prometheus monitors its own
/metricsendpoint.
Deploy with Docker Compose
In this section, you create and deploy the Docker Compose stack that runs Prometheus behind Traefik. Docker Compose manages both containers, applies the environment variables from your .env file, and automatically configures HTTPS routing through Traefik.
Create a new Docker Compose manifest.
CONSOLEAdd the following content.
YAMLSave and close the file.
This configuration defines:
- services: Two containerized components deliver the monitoring solution:
- traefik: Accepts external connections, provisions TLS certificates, and proxies traffic to Prometheus.
- prometheus: Executes the metrics collection engine and maintains time-series databases.
- image: Container images are retrieved from their respective Docker Hub repositories.
- container_name: Static container names simplify administrative tasks such as log analysis and service inspection.
- command (Traefik): Establishes Traefik's operational parameters including Docker container discovery, port binding (80/443), HTTP-to-HTTPS enforcement, and automated Let's Encrypt certificate acquisition via HTTP challenge validation.
- ports (Traefik): Binds ports 80 and 443 to the host network interface for accepting inbound HTTP/HTTPS connections.
- expose (Prometheus): Makes port 9090 available within the Docker network for Traefik communication while preventing direct external access.
- volumes:
- Bind-mounted directories (
./prometheus-config,./prometheus-data) ensure configuration files and metric databases survive container recreation. - The
letsencryptnamed volume retains TLS certificate data between container lifecycles. - Mounting
/var/run/docker.sockgrants Traefik read-only access to the Docker daemon for service discovery.
- Bind-mounted directories (
- command (Prometheus): Defines configuration file location and specifies the directory path for storing time-series metric data.
- labels (Prometheus): Traefik routing directives that activate proxy functionality, establish domain-based routing rules, and select the appropriate certificate resolver.
- restart: unless-stopped: Implements automatic container recovery following host reboots or service failures, excluding manual stop events.
- services: Two containerized components deliver the monitoring solution:
Create and start the services.
CONSOLEVerify that the services are running.
CONSOLEOutput:
Both containers are running as expected. Prometheus collects metrics while Traefik accepts connections on ports
80and443.View the logs of the services.
CONSOLEFor more information on managing a Docker Compose stack, see the How To Use Docker Compose article.
Access Prometheus
In this section, you access the Prometheus web interface and verify your monitoring setup by running basic queries to explore collected metrics.
Open the Prometheus web interface in your browser.
Click Status > Target health to view monitored endpoints. You should see the
prometheusjob with a state ofUP.Navigate to the Query tab to explore metrics using PromQL.
Try these example queries:
Check target scrape status:
PROMQLView CPU usage:
PROMQLView memory usage:
PROMQL
Click Execute after entering each query to see the results. Switch to the Graph tab to visualize metrics over time.
Conclusion
You have successfully deployed Prometheus for system monitoring with encrypted HTTPS connectivity. The Docker Compose deployment includes both the Prometheus metrics engine and Traefik reverse proxy, with durable storage ensuring data retention across restarts. Let's Encrypt certificate automation provides secure connections while Traefik handles intelligent request routing. Your monitoring infrastructure is ready for expansion through additional exporters, custom application instrumentation, and alerting rules.


0 Comments
Be the first to comment and share your perspective with the community.