
How to Deploy Vector – High-Performance Observability Data Pipeline
Vector is an open-source, high-performance observability data pipeline built with Rust. It collects, transforms, and routes logs, metrics, and traces from multiple sources to various destinations with minimal resource overhead. Vector's unified architecture eliminates the need for separate agents for different data types, while its built-in buffering and retry mechanisms ensure reliable delivery even during downstream service outages.
This article explains how to deploy Vector on a Linux server using Docker Compose with Traefik providing automatic HTTPS for the GraphQL API endpoint. It covers directory setup, configuration management, and demonstrates a practical use case by ingesting sample logs and forwarding them to multiple destinations.
Prerequisites
Before you begin, you need to:
- Have access to a Linux-based server (with at least 2 CPU cores and 4 GB of RAM) as a non-root user with sudo privileges.
- Install Docker and Docker Compose.
- Create a DNS A record pointing to your server's IP address (for example,
vector.example.com).
Set Up the Directory Structure, Configuration, and Environment Variables
Vector requires a configuration file defining data sources, transforms, and destinations. The setup includes persistent storage for buffer data to prevent loss during restarts and an optional GraphQL API for querying pipeline health and metrics.
Create the project directory with subdirectories for configuration and data persistence.
console$ mkdir -p ~/vector/{config,data}
config: Stores the Vector configuration file (vector.yaml) that defines sources, transforms, and sinks.data: Persists buffer data to prevent log loss during container restarts or crashes.
Navigate to the project directory.
console$ cd ~/vector
Create an environment file to store configuration variables.
console$ nano .env
Add the following content:
iniDOMAIN=vector.example.com LETSENCRYPT_EMAIL=admin@example.com
Replace:
vector.example.comwith your registered domain name.admin@example.comwith your email address for Let's Encrypt certificate notifications.
Save and close the file.
Create the Vector configuration file that defines the data pipeline.
console$ nano config/vector.yaml
Add the following configuration:
yamlapi: enabled: true address: "0.0.0.0:8686" sources: demo_logs: type: "demo_logs" format: "syslog" interval: 1.0 http_input: type: "http_server" address: "0.0.0.0:8080" decoding: codec: "json" transforms: parse_logs: type: "remap" inputs: - "demo_logs" - "http_input" source: | .processed_at = now() .pipeline = "vector-demo" sinks: console_output: type: "console" inputs: - "parse_logs" encoding: codec: "json" file_output: type: "file" inputs: - "parse_logs" path: "/var/lib/vector/logs-%Y-%m-%d.log" encoding: codec: "json" http_output: type: "http" inputs: - "parse_logs" uri: "https://httpbin.org/post" encoding: codec: "json" batch: max_bytes: 1048576 timeout_secs: 10
Save and close the file.
This configuration establishes a complete observability pipeline:
- api: Enables the Vector GraphQL API on port 8686, which provides a health check endpoint (
/health) and an interactive GraphQL Playground (/playground). - sources: Defines data ingestion points:
demo_logs: Generates synthetic syslog-formatted events for testing (1 event per second). Remove this source and its reference in theparse_logstransform inputs for production deployments to avoid unnecessary log volume.http_input: Accepts JSON-formatted logs via HTTP POST on port 8080.
- transforms: Applies data manipulation using Vector Remap Language (VRL):
parse_logs: Addsprocessed_attimestamp andpipelineidentifier to all events.
- sinks: Routes processed data to multiple destinations:
console_output: Prints logs to stdout, visible viadocker compose logs vector.file_output: Writes logs to date-stamped files in/var/lib/vector, which maps to the./data/directory on the host due to the bind mount.http_output: Forwards logs to an external HTTP endpoint (configured to use httpbin.org for demonstration).
- api: Enables the Vector GraphQL API on port 8686, which provides a health check endpoint (
Deploy with Docker Compose
The deployment stack consists of Traefik for reverse proxy and certificate management, plus the Vector container with mounted configuration and data directories. This configuration uses the official Vector Docker image.
Create the Docker Compose manifest.
console$ nano docker-compose.yaml
Add the following configuration:
yamlservices: traefik: image: traefik:v3.6 container_name: traefik command: - "--providers.docker=true" - "--providers.docker.exposedbydefault=false" - "--entrypoints.web.address=:80" - "--entrypoints.websecure.address=:443" - "--entrypoints.web.http.redirections.entrypoint.to=websecure" - "--entrypoints.web.http.redirections.entrypoint.scheme=https" - "--certificatesresolvers.letsencrypt.acme.httpchallenge=true" - "--certificatesresolvers.letsencrypt.acme.httpchallenge.entrypoint=web" - "--certificatesresolvers.letsencrypt.acme.email=${LETSENCRYPT_EMAIL}" - "--certificatesresolvers.letsencrypt.acme.storage=/letsencrypt/acme.json" ports: - "80:80" - "443:443" volumes: - "./letsencrypt:/letsencrypt" - "/var/run/docker.sock:/var/run/docker.sock:ro" restart: unless-stopped vector: image: timberio/vector:0.44.0-alpine container_name: vector expose: - "8080" - "8686" volumes: - "./config/vector.yaml:/etc/vector/vector.yaml:ro" - "./data:/var/lib/vector" labels: - "traefik.enable=true" # GraphQL API / Playground (port 8686) - "traefik.http.routers.vector-api.rule=Host(`${DOMAIN}`) && (PathPrefix(`/playground`) || PathPrefix(`/graphql`) || PathPrefix(`/health`))" - "traefik.http.routers.vector-api.entrypoints=websecure" - "traefik.http.routers.vector-api.tls.certresolver=letsencrypt" - "traefik.http.routers.vector-api.service=vector-api" - "traefik.http.services.vector-api.loadbalancer.server.port=8686" # HTTP log ingestion (port 8080) - "traefik.http.routers.vector-ingest.rule=Host(`${DOMAIN}`) && PathPrefix(`/ingest`)" - "traefik.http.routers.vector-ingest.entrypoints=websecure" - "traefik.http.routers.vector-ingest.tls.certresolver=letsencrypt" - "traefik.http.routers.vector-ingest.service=vector-ingest" - "traefik.http.services.vector-ingest.loadbalancer.server.port=8080" - "traefik.http.middlewares.strip-ingest.stripprefix.prefixes=/ingest" - "traefik.http.routers.vector-ingest.middlewares=strip-ingest" restart: unless-stopped
Save and close the file.
In the above manifest:
- services: Orchestrates two containers through Docker Compose:
- traefik: Operates as the reverse proxy, handling TLS termination and routing.
- vector: Runs the observability data pipeline with persistent configuration and storage.
- image: Specifies the container image for each service. The Vector image uses a pinned version (
0.44.0-alpine) for reproducibility; check the Vector releases for the latest stable version. The Alpine variant provides a minimal footprint. - container_name: Assigns fixed names to containers for easier identification in logs and management operations.
- command (Traefik): Configures Docker provider discovery, dual entry points for HTTP/HTTPS, automatic HTTP-to-HTTPS redirection, and Let's Encrypt certificate provisioning via HTTP challenge.
- ports (Traefik): Publishes ports
80and443on the host for external traffic handling. - expose (Vector): Makes ports
8080(HTTP log ingestion) and8686(GraphQL API/Playground) accessible to Traefik for internal routing without binding them to the host. - volumes:
- The
./letsencryptbind mount stores TLS certificates persistently across container restarts. - The Docker socket (
/var/run/docker.sock) grants Traefik the ability to discover services and update routes dynamically. - The
vector.yamlbind mount (read-only) injects the pipeline configuration into the container. - The
databind mount preserves buffered logs and state across restarts.
- The
- labels (Vector): Registers the container with Traefik and defines two routers:
vector-api: Routes requests matching/playground,/graphql, or/healthto the GraphQL API on port 8686.vector-ingest: Routes requests matching/ingestto the HTTP log ingestion endpoint on port 8080. Thestrip-ingestmiddleware removes the/ingestprefix before forwarding, so Vector receives requests at its root path. Both routers use HTTPS with automatic Let's Encrypt certificates.
- restart: unless-stopped: Ensures containers recover automatically after failures or system restarts unless manually stopped.
- services: Orchestrates two containers through Docker Compose:
Launch the containers.
console$ docker compose up -d
Verify both services are operational.
console$ docker compose ps
The output displays two running containers with Traefik listening on ports 80 and 443.
Check the service logs to confirm Vector loaded the configuration successfully.
console$ docker compose logs vector
Output:
vector    | Vector v0.44.0 (x86_64-unknown-linux-musl)
vector    | INFO vector: Loading configs. path=["/etc/vector/vector.yaml"]
vector    | INFO vector::sources::demo_logs: Demo logs source started.
vector    | INFO vector::sources::http_server: HTTP server listening. addr=0.0.0.0:8080
vector    | INFO vector::api: GraphQL API is running. addr=0.0.0.0:8686
For more information on managing a Docker Compose stack, see the How To Use Docker Compose article.
Access the Vector GraphQL Playground
Vector exposes a GraphQL API for querying pipeline state and metrics programmatically. It also includes a GraphQL Playground UI for interactive exploration.
Open your web browser and navigate to the GraphQL Playground at https://vector.example.com/playground, replacing vector.example.com with your configured domain.
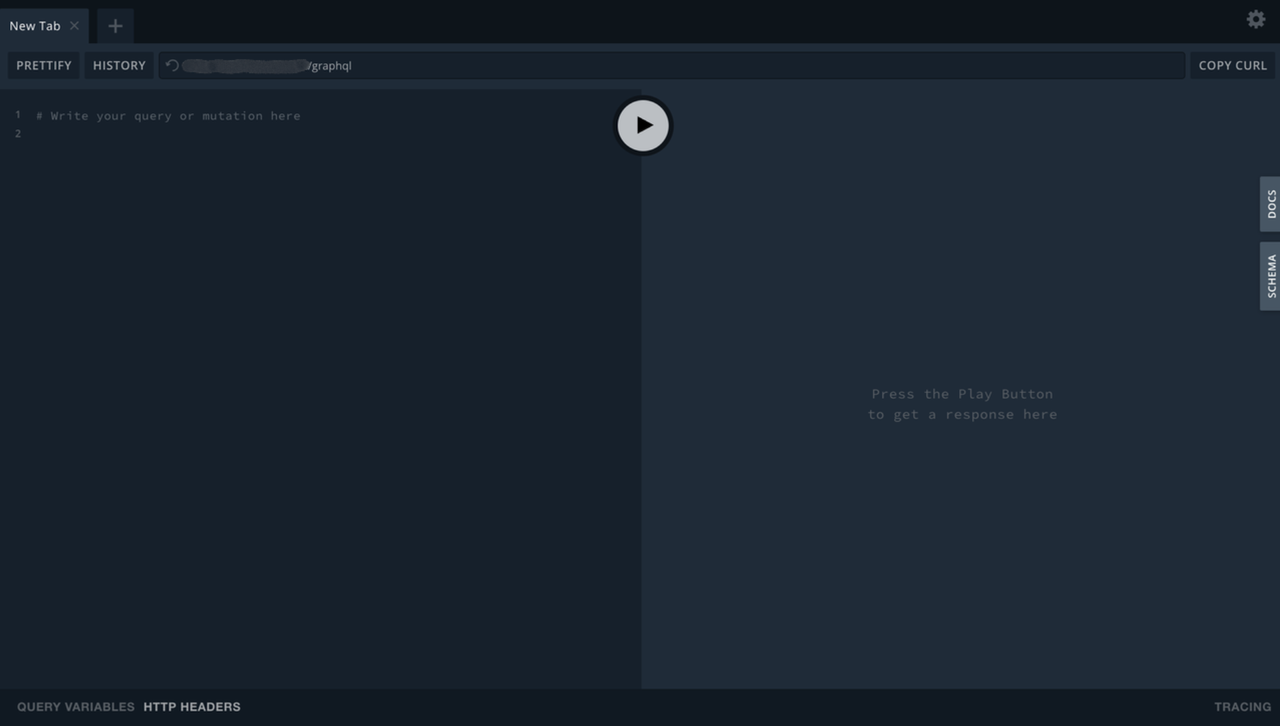
Use the Playground to run GraphQL queries against Vector's API and inspect components and metrics. To check instance health separately, send a request to the /health endpoint.
Ingest and Forward Sample Logs
Vector's demo source generates synthetic logs automatically. The following steps demonstrate ingesting custom logs via HTTP and verifying delivery to multiple destinations.
View the real-time log output in the container logs. The demo source generates one event per second.
console$ docker compose logs -f vector
Output:
{"host":"localhost","message":"<70>1 2026-02-18T21:00:01.123Z up.associates BryanHorsey 7326 ID144 - A bug was encountered but not in Vector, which doesn't have bugs","pipeline":"vector-demo","processed_at":"2026-02-18T21:00:01.123Z","service":"vector","source_type":"demo_logs","timestamp":"2026-02-18T21:00:01.123Z"}
{"host":"localhost","message":"<33>1 2026-02-18T21:00:02.123Z we.loans BronzeGamer 6742 ID646 - Pretty pretty pretty good","pipeline":"vector-demo","processed_at":"2026-02-18T21:00:02.123Z","service":"vector","source_type":"demo_logs","timestamp":"2026-02-18T21:00:02.123Z"}
Press
Ctrl+Cto stop following the logs.Send a custom log entry to the HTTP input endpoint through Traefik. Replace
vector.example.comwith your configured domain:console$ curl -X POST https://vector.example.com/ingest \ -H "Content-Type: application/json" \ -d '{"level":"error","service":"api","message":"Database connection timeout","user_id":12345}'
On success, Vector returns an HTTP 200 response with an empty body. If curl displays no output, the log was accepted successfully. Traefik strips the
/ingestprefix and forwards the request to Vector's HTTP server on port 8080.Verify the log was processed by searching the file output, which is more reliable for targeted verification than the console output that generates continuous output from the demo source:
console$ grep "Database connection timeout" data/logs-*.log
Output:
{"level":"error","message":"Database connection timeout","path":"/","pipeline":"vector-demo","processed_at":"2026-02-18T21:04:56.422124013Z","service":"api","source_type":"http_server","timestamp":"2026-02-18T21:04:56.421967028Z","user_id":12345}Check the file sink output to confirm logs are written to disk.
console$ ls -lh data/
Output:
-rw-r--r-- 1 root root 104K Feb 18 21:05 logs-2026-02-18.logExamine the file contents.
console$ tail -3 data/logs-2026-02-18.log
Output:
{"host":"localhost","message":"<33>1 2026-02-18T21:06:53.473Z we.loans BronzeGamer 6742 ID646 - Pretty pretty pretty good","pipeline":"vector-demo","processed_at":"2026-02-18T21:06:53.473663958Z","service":"vector","source_type":"demo_logs","timestamp":"2026-02-18T21:06:53.473529846Z"}Verify the HTTP source received your custom log by filtering for
http_serverevents.console$ docker compose logs vector | grep "http_server"
Output:
vector | {"level":"error","message":"Database connection timeout","path":"/","pipeline":"vector-demo","processed_at":"2026-02-18T21:01:57.156169762Z","service":"api","source_type":"http_server","timestamp":"2026-02-18T21:01:57.155991507Z","user_id":12345}This confirms your custom log was received via HTTP and processed through the pipeline. The
http_outputsink forwards these logs to httpbin.org silently (no success messages are logged by default).
Conclusion
You have successfully deployed Vector on your server using Docker Compose with Traefik for automatic HTTPS on the API endpoint. The setup provides a high-performance observability data pipeline with real-time log ingestion, transformation, and multi-destination routing. Vector's unified architecture handles logs, metrics, and traces with minimal resource consumption, while its built-in buffering ensures reliable delivery during downstream outages. The persistent data directory preserves in-flight data across restarts, and the GraphQL API provides programmatic access to pipeline health and metrics. For advanced use cases including metric collection, distributed tracing, and enterprise integrations, visit the official Vector documentation.